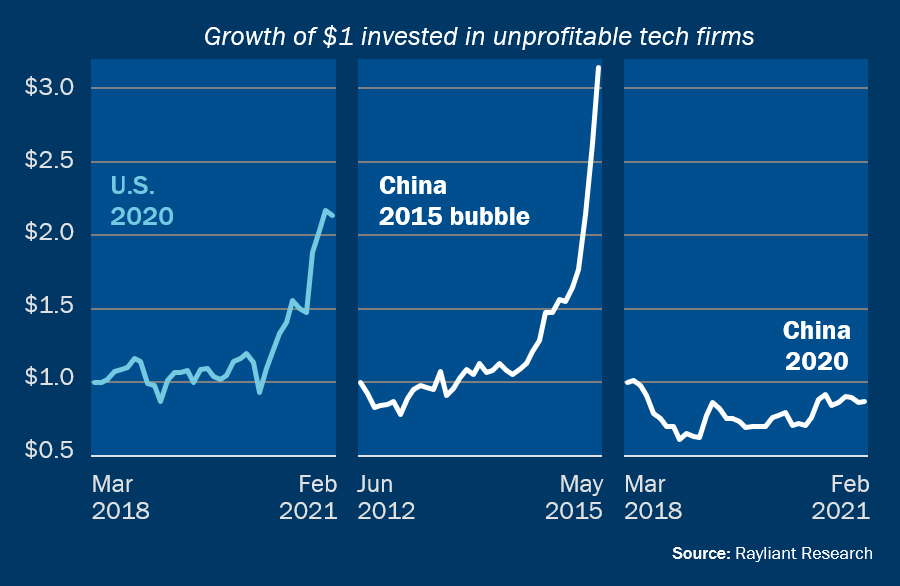
As U.S. equities hit record highs to close out 2020, market observers pointed to the rally in shares of unprofitable new economy stocks as a potential sign of investor overexuberance. A simple portfolio made up of money-losing U.S. companies in the tech sector shot up nearly 130% from the depths of March 2020 through February 2021.

Those tracking China’s mainland stock market will naturally wonder whether one of 2020’s best performing major markets—up over 27% last year—has seen similar signs of froth. That was certainly the case in the runup to an infamous bubble in China A shares back in 2015, when a price plot of junk tech stocks went nearly vertical.
Investors will be surprised to find that the situation in 2020 was a much different one for Chinese stocks, whose recent rally has been fueled more by genuine fundamental improvement amidst a strong economic rebound from the pandemic than irrational overvaluation of unprofitable new economy shares, which rose only modestly on the year, increasing by just 14% and underperforming the broader market.
Subscribe to receive the latest Rayliant research, product updates, media and events.
Subscribe
Sign upIssued by Rayliant Investment Research d/b/a Rayliant Asset Management (“Rayliant”). Unless stated otherwise, all names, trademarks and logos used in this material are the intellectual property of Rayliant.
This document is for information purposes only. It is not a recommendation to buy or sell any financial instrument and should not be construed as an investment advice. Any securities, sectors or countries mentioned herein are for illustration purposes only. Investments involves risk. The value of your investments may fall as well as rise and you may not get back your initial investment. Performance data quoted represents past performance and is not indicative of future results. While reasonable care has been taken to ensure the accuracy of the information, Rayliant does not give any warranty or representation, expressed or implied, and expressly disclaims liability for any errors and omissions. Information and opinions may be subject to change without notice. Rayliant accepts no liability for any loss, indirect or consequential damages, arising from the use of or reliance on this document.
Hypothetical, back-tested performance results have many inherent limitations. Unlike the results shown in an actual performance record, hypothetical results do not represent actual trading. Also, because these trades have not actually been executed, these results may have under- or over- compensated for the impact, if any, of certain market factors, such as lack of liquidity. Simulated or hypothetical results in general are also subject to the fact that they are designed with the benefit of hindsight. No representation is being made that any account will or is likely to achieve profits or losses similar to those shown. In fact, there are frequently sharp differences between hypothetical performance results and the actual results subsequently achieved by any investment manager.
You are now leaving Rayliant.com
The following link may contain information concerning investments, products or other information.
PROCEED