Sluggishness in the housing market persists
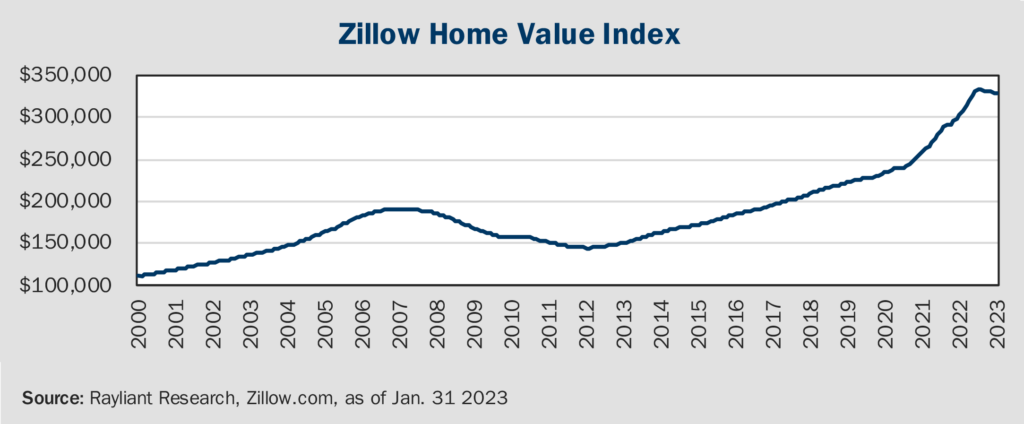
Discussion of the housing market these days always begins with mortgage rates. Last week, the 30-year fixed rate climbed to 6.7%, marking the highest rate since November 2022. That increase in the cost of borrowing led to a 6% decrease in mortgage applications. Many who follow properties will remember the surge in application activity when mortgage rates fell to 6.2% in January. That reprieve turned out to be short lived, and we have seen a steady decline in applications for three straight weeks. The mortgage spread, which captures the difference between mortgage rates and Treasury yields, remained elevated at 3%. As Perspectives has highlighted in the past, a large part of what drives that spread is volatility in rate expectations, which mortgage lenders pass off to borrowers in the form of higher loan rates. As the mortgage spread climbs, housing affordability falls. Even so, rocketing rates have not cratered home prices, but just led to stagnation. As Zillow prices (see below) indicate, the average US home value in October-December 2022 was only 3% lower than the most recent peak in April-June 2022.

How is that possible? On the demand side, potential homebuyers are backing out, which results in a decrease in new mortgage applications and a longer shelf time for the existing houses to sell. Meanwhile, existing homeowners are locked into ultra-low fixed rate mortgages signed at sub-3%, making them reluctant to sell and limiting the supply of existing homes. A tight labor market combined with higher wages and more savings buffer largely eliminates the possibility of widespread distress in residential real estate like that witnessed in 2008, though prices are unlikely to continue the seemingly exponential growth observed in the chart above.
How will real estate impact the broader US economy?
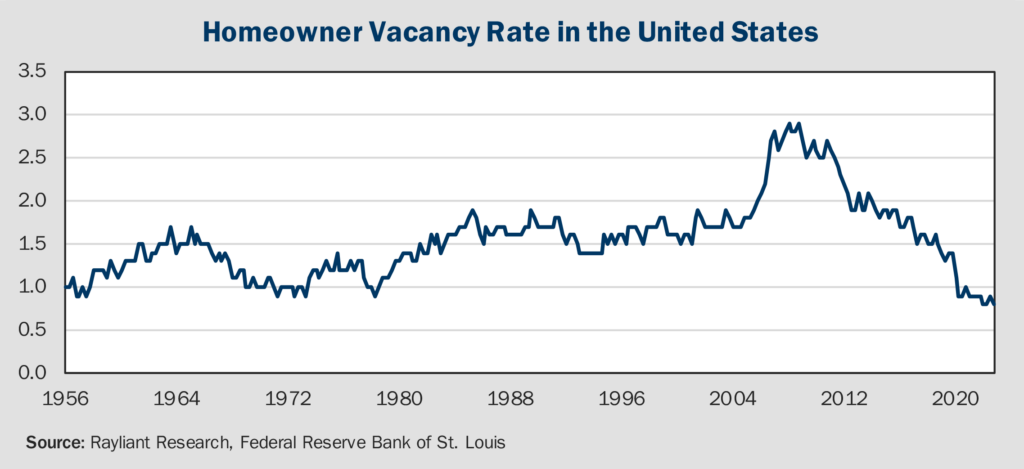
Based on the latest data from the US Census Bureau, 2020’s pandemic prompted a pickup in home sales and triggered a building boom that helped with supply. Even with that bump, both the ratio of home inventory to annual sales and the homeowner vacancy rate (see below) are at record lows today. In other words, some marginal improvement on new home supply hasn’t moved the needle on a growing imbalance between supply and demand in America’s residential property sector.

How about those recent rate increases? Taking a long-term demographical perspective, residential housing investment should track the number of American households. With a growing population, we are currently below the long-run trendline of underlying housing demand. As rates have increased over the past year, while current homeowners are happy with their 30-year loans at rates set before the Fed sprung into action, new homebuyers can’t afford a mortgage and builders will naturally stop doing so much construction as demand falls off. Accordingly, as the Fed’s policy became restrictive, housing registered the first impact, with residential fixed investment down from 4% to 2% of the US GDP. That hurts at the margin, but it clearly won’t sink the broader economy. As long as the bottom doesn’t fall out of home prices, there shouldn’t be a ‘wealth effect’ that breaks the American consumer, either. Instead, it probably makes the most sense to view rates’ impact on residential real estate as more like a leading indicator of Fed policy working its way through the system.
US stocks are cheaper—but still not cheap
The optimism that carried over from last year’s Santa Claus rally has clearly faded. In recent days, the market narrative has been to blame signs of stickier inflation for the about-face in risk assets. Although inflation was the trigger, high equity valuations at the beginning of 2022 certainly set the stage for a decline in equities. And even after declines amidst last year’s bear market, US stocks are still looking expensive by several key valuation metrics. For example, looking at prices with respect to earnings forecast over the next twelve months, we find the S&P 500 trading at a forward price-to-earnings (P/E) ratio of over 18x—just about average over the last 30 years. That pricing is consistent with the historically low equity risk premium, which we highlighted last week, underscoring how little stock market investors are being paid to bear risk at present.
US growth has almost never been so expensive
Things look even worse when we consider how much investors in US stocks are paying for growth. To measure that, Fidelity Investments’ legendary partner Peter Lynch pioneered the use of the PEG ratio: a model that measures a company’s P/E relative to its projected growth rate. The higher the PEG ratio, the more expensive is future growth in companies’ earnings. According to data compiled by economist Ed Yardeni, the S&P 500 currently trades at a PEG of around 1.8. How high is that from a historical perspective? Since data begin in 1995, it has only read higher once: in late 2020, when it approached 2.5. At its peak before the last two major crises, the Dot-Com Bubble and the Global Financial Crisis, the S&P 500 PEG topped out at around 1. We can safely say that growth is pricey, but that’s only a problem if corporate profits can’t keep up. Of course, a looming earnings contraction—glimpses of which we saw in last year’s Q4 results—and a potential recession make that a serious concern.
Central bank’s soaring debt burden is set to roll bigger
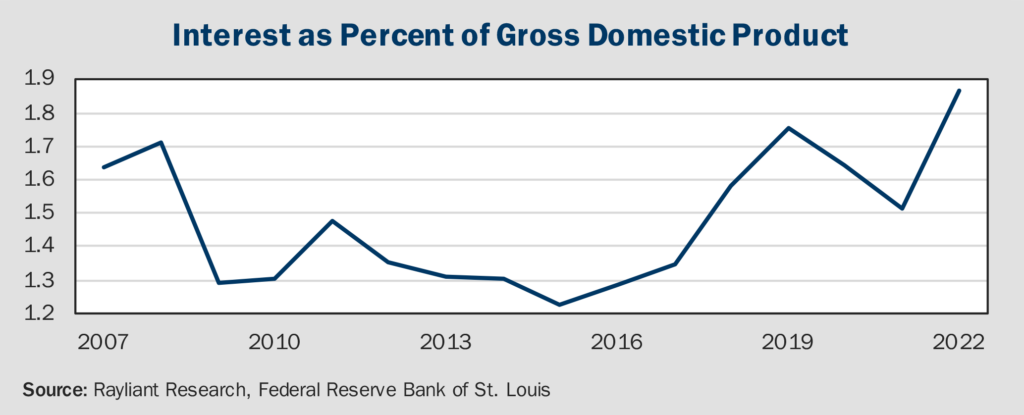
Rising borrowing costs don’t just bite the general public. Governments also feel the pain of higher rates, and America’s fiscal burden is currently growing at a dramatic rate. In past decades, the US managed to maintain large deficits on the back of a prolonged low-interest-rate environment. Central banks accomplished low rates, in part, through Quantitative Easing (QE), which saw the Fed and their peers purchase large amounts of government debt, creating reserves to pay for the purchase. Central banks paid very little on the reserves and earned profits on the government bonds they held. The Fed was raking in $100 billion a year on that spread alone. Now, with the monetary policy pivot of 2022, this situation has reversed, and the Fed is paying much higher interest on reserves it created. The bonds purchased by the Fed as part of QE don’t disappear, they remain on the bank’s books until they “retire,” and the interest paid on those bank reserves are recorded as sovereign liabilities, just like US Treasury bonds. All of this means that the US government’s ongoing interest payments have ballooned as a proportion of GDP, as can be seen below.

Considering the further complications of partisan bickering over necessary increases to the US debt ceiling, one cannot be blamed for thinking the situation looks pretty bleak. MSCI recently noted that this pessimism has prompted much greater trading in credit default swaps on US government debt—insurance contracts that pay off if America defaults—with the likelihood of the US missing a payment more than tripling since the beginning of the year. While we are confident the US will ultimately avoid a default, we expect concerns over the national debt to mount as the deadline for an increase in the debt ceiling approaches. That will inject even more volatility into market conditions that will likely be fragile enough when the late-summer deadline rolls around.
You are now leaving Rayliant.com
The following link may contain information concerning investments, products or other information.
PROCEED