First-quarter earnings beats belie economic weakness
Despite prior downward revisions in analyst forecasts setting a rather low bar for companies reporting Q1 results last week, the market cheered positive surprises from a number of firms, including Meta, whose earnings beat sent the stock flying up 14% post announcement. Indeed, with around half of S&P 500 companies having reported results as of April 28th, FactSet data showed 79% of those announcing earnings bested analyst estimates, by an average margin of 6.9%. That may sound impressive, but analyst forecasts are often criticized as made to be beaten, and over the last five years, an average of 77% of companies outperform Wall Street estimates—so, this quarter is hardly an outlier. FactSet analysis also shows that the average size of beats over the last half decade has been 8.4%, significantly higher than what companies reported in April. And because sell-side research has been steadily cutting forecasts in light of obvious struggles for the US economy, even though companies are outperforming analysts’ estimates, Q1 earnings are still tracking to be significantly lower than those one year prior, representing a second consecutive quarter of year-over-year EPS contraction at American firms. Meta’s Q1 earnings, for example, were down 24% versus results in the prior year.
GDP report shows growth slowing to start 2023
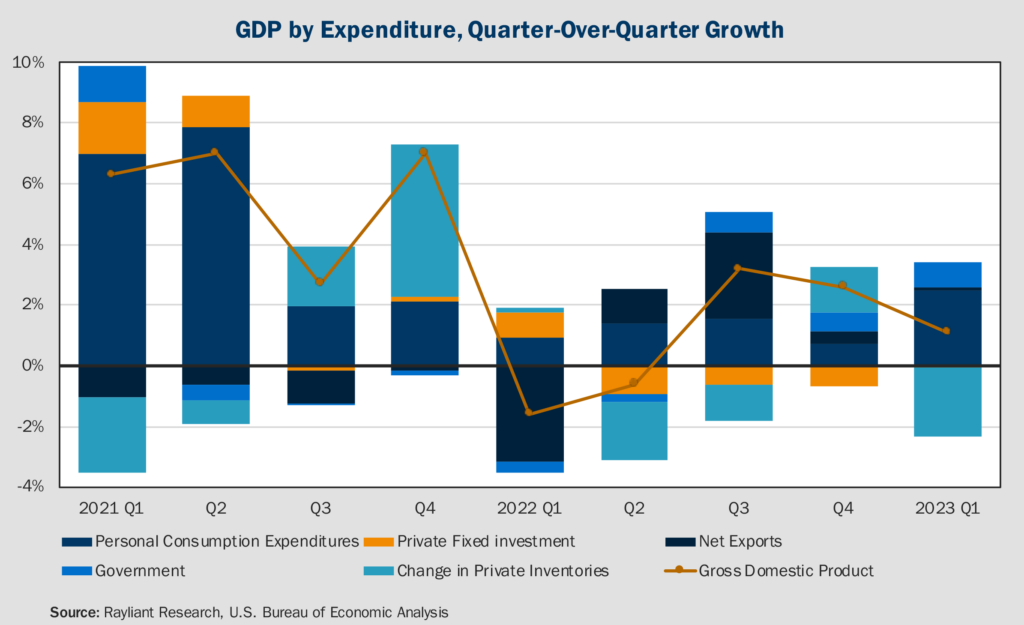
Investors’ glass-half-full reaction to last week’s earnings reports also served to mask relatively bleak economic data indicating mounting risk of stagflation: the collision of declining growth and rising prices. With respect to the former, last Thursday’s Commerce Department report of US GDP pegged first-quarter growth of the US economy at an annualized rate of 1.1%. That was an abrupt slowdown from the 2.6% growth rate recorded in the final quarter of 2022, and well short of economists’ expectations of a 2% increase. Households remained the driving force behind growth (see breakdown below), with inflation-adjusted consumer spending increasing at an annual rate of 3.7%, up from 1% in the previous quarter. The biggest detractor from GDP was a drawdown in inventories, which declined by 2.3% for the quarter—though it’s worth noting that this could set the stage for a stronger Q2 if companies are forced to ramp up production in coming months to replenish stocks. Further parsing the results, one finds more cause for concern. For one thing, although January retail spending was exceptionally strong, consumers’ retail purchases slipped in February and March. Likewise, durable goods spending, reported on Wednesday, showed that companies are responding to higher costs by dialing back spending.
Where might consumer spending go from here?
Squinting past an inflation-adjusted decline in households’ spending over four of the last five months, consumers remained the obvious bright spot in Q1, with gains in spending for the quarter on both services and goods, the latter of which popped by 6.5%, its biggest jump in nearly two years. Increasingly, forecasters have spent much time considering how spending habits will evolve as the pandemic fades further into the rearview. Along those lines, some analysts have argued that goods spending may actually settle in at a higher plateau due to sustained stronger consumer finances, particularly for lower-income groups. Goldman Sachs, for example, reports that real wage growth for the bottom half of the US population was 6.2% higher in 2023 Q1 than it was in 2019, and almost 10% higher than in 2017. Lower-income consumers tend to spend a greater share of their income on goods, significantly driving up overall consumer spending. On the other hand, there are questions as to how sustainable these changes will be, particularly if we enter a cyclical downturn, which would have the most negative impact on low-income consumers. The University of Michigan consumer sentiment survey, also reported last Thursday, seems to support those concerns, coming in flat for the month as fears of layoffs and the continued impact of high interest rates mount.
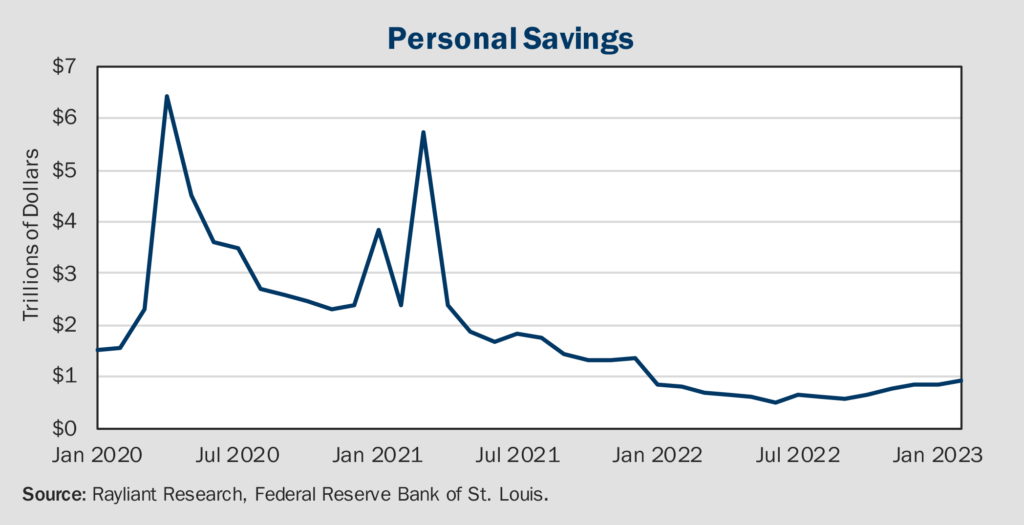
Household savings play an important role
Another factor to consider is excessive savings accumulated by US families in the midst of COVID lockdowns and government stimulus, plotted below. One thing made clear by the data is that Americans have largely blown through excess savings accumulated in the last few years. That could explain another data point from the New York Fed, showing US credit card debt skyrocketing by $61 billion during the fourth quarter of 2022, the biggest increase in history, putting total credit card debt at just under a trillion dollars, also a record. We also note that a large portion of US households’ excess savings—particularly among lower-income and middle-class Americans—goes to their housing, which is also the core source of their wealth. Because housing is illiquid and low-rate mortgages make home purchases within the last few years particularly sticky, a big chunk of households’ savings as effectively locked up. Not only is it questionable whether the Fed can curb inflation without a recession: any sustained demand from high-income consumers could make both growth and inflation stickier, raising the chances of Fed overtightening. As payroll growth slows down, consumer credit availability tightens up, and saving rates decline, all factors will weigh on average consumers and further weaken US consumption going forward.
Persistently rising prices round out stagflation concerns
The other big piece of macro news shaping our view last week was a report of March personal consumption expenditures (PCE), one of the Fed’s preferred gauges of inflation. While the headline number cooled, coming in at a 4.2% increase, down from a final February reading of 5.1%, core PCE, which strips out volatile food and energy prices, only dropped slightly, from 4.7% year-over-year growth in prices during February to 4.6% in March: a number that we find highly concerning. That was only slightly mitigated by a deceleration in service costs, which itself seemed to be overshadowed by the US Labor Department’s employment cost measure rising 1.2% in Q1, surpassing estimates. Overall, we see the transmission of rising prices from goods to services—where inflation tends to be stickier—as problematic for the Fed, whose concern over inflation is not so much whether it’s decelerating, but how close it is to their target. At present, there is no doubt the gap is far too great for comfort.
Debate within the Fed underscores risk of policy error
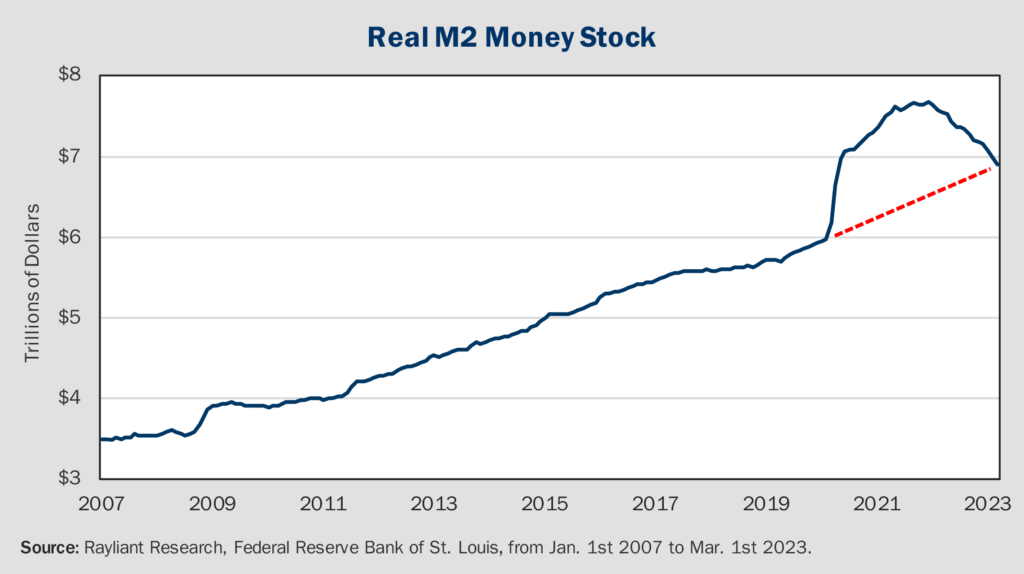
We have tended to emphasize labor markets as a major source of inflation, consistent with Fed chair Jay Powell’s vocal assessment that wage growth has been feeding hard-to-tame inflation. But that’s not the only view within the Fed, and there has been significant debate as to whether hikes should continue and what the Fed’s endgame and even its motivation ought to be. In recent days, Austan Goolsbee and James Bullard, presidents of the Chicago and St. Louis Feds, respectively, have been getting some attention as Fed officials touting different dynamics. Goolsbee has been one of the dovish marks on recent FOMC dot plots, citing wages as more a lagging indicator of inflation than a cause of rising prices. Meanwhile Bullard has expressed a hawkish view—he admitted to have been in the camp calling for a 50 bps hike back in January—but suggests future rate increases are aimed not at reining in wage growth, but at cooling inflation expectations, which he sees as playing a much greater role. Recent data on money supply might help to resolve one question about what’s driving inflation. A March report from the Fed on M2 revealed that the money supply has come down significantly in recent months, finally returning to its pre-pandemic growth trend (see below). With that big bulge typically preceding a surge in inflation returning to normal, at least one potential source of excess purchasing power has been eliminated. Of course, picking up on Mr. Goolsbee’s observations, it stands to reason that a focus on lagging indicators in the face of clear progress dealing with a shock to M2 certainly heightens the risk of overtightening.
You are now leaving Rayliant.com
The following link may contain information concerning investments, products or other information.
PROCEED