Nvidia blows analysts away, tests trillion-dollar valuation
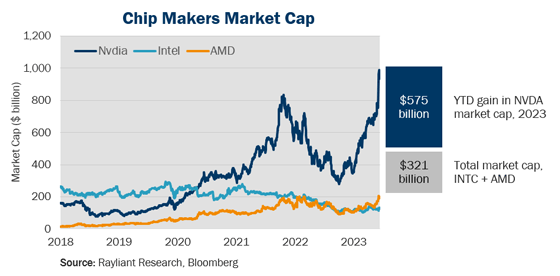
Two weeks ago, Nvidia reported revenues of $7.2 billion in the first quarter, driven by record data center sales, which the company in turn attributed to exponential growth in the computational demands of immensely popular generative AI models. Even amidst the ChatGPT craze of Q1, analysts had only been forecasting $6.5 billion in sales, and the company’s stock popped 26% in afterhours trading on the news. NVDA shares ended up gaining $207 billion in market value in just two days, inching closer to a rare trillion-dollar market cap, which it briefly topped on May 30th before giving some back. At the end of May, Nvidia’s year-to-date increase in market cap was roughly 1.8 times the total combined market cap of its two biggest competitors, Intel and AMD (see below).

The power of AI is unquestionable, but novel tech is often over-hyped
Arguably no technology has been as talked about or written about in 2023 as ChatGPT, the groundbreaking chatbot developed by OpenAI. As such, investors looking at the eyepopping gains in Nvidia’s shares this year might rightly ask whether markets have objectively reacted to earnings or simply given in to the frenzy around anything remotely associated with AI. Thinking back to the late 90s, some of us will remember a time before smartphones, when the Internet was a brave new frontier and companies adding a ‘.com’ to their name immediately commanded massively higher multiples. Wall Street has a spectacular history of promoting the latest technological breakthrough as a supposedly bulletproof ‘this-time-is-different’ investment thesis. Is today’s AI hype just an Internet bubble redux?
Evaluating the fundamental case for Nvidia’s boom
In the case of Nvidia, it must be said: there’s clearly something real behind the hype. The company’s graphics processing units (GPUs) play a critical role in driving generative language models that power applications like ChatGPT and have a leg up on traditional central processing units (CPUs) because they’re not one-size-fits-all, but rather specialized designs—e.g., built for AI tasks—and can therefore run many more calculations in parallel. Nvidia, which has also supplied chips for computer gamers and cryptocurrency miners, has further established itself in the industry by building a massive software ecosystem, the CUDA parallel computing platform, around its high-performance chips and continues to innovate faster architectures, with plans to release a next-generation H100 GPU later this year. We note that it’s often not the ‘disruptors’ that offer shareholders the greatest financial participation in technological leaps, but the companies supplying hardware and software necessary to make such big advances possible. Chipmakers like Nvidia, Intel, and AMD are decidedly in the latter camp.
Is it too late to get in on the action?
While Nvidia certainly has the fundamentals to support the recent rally in its shares—and we don’t doubt the applications for its chips, including in the AI space, will only grow from here—there’s always a question as to when the good news is fully priced into a stock. For one thing, Nvidia isn’t alone in this space. Companies like Google and Microsoft have their sights set on grabbing part of a rapidly expanding market, with Google’s ultra-fast tensor processing units (TPUs) slated for integration in its cloud servers by 2025 and Microsoft’s own RAMP chip project already in use by the US Department of Defense. Moreover, in the event the US economy turns down, a company trading at 36x sales is unquestionably vulnerable to a valuation haircut. Of course, that doesn’t make NVDA a ‘sell’, and Wall Street analysts remain bullish on AI in general and Nvidia in particular. We would, however, suggest that investors hoping to participate in the current AI boom consider the benefits of diversification within the space, as well as the possibility of a little downside protection in the event reality takes longer than expected to catch up with the hype already priced in.
US labor market seen strengthening in May
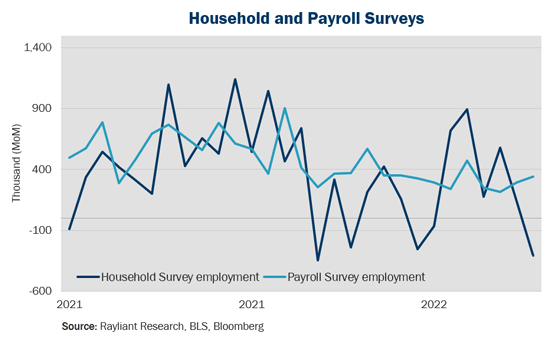
Investors banking on a softening jobs data to strengthen the Fed’s case for pausing at their June meeting had plenty to process last week, with reports on the condition of the US labor market delivered by ADP, the US Department of Labor, and the Bureau of Labor Statistics (BLS). According to Wednesday’s Job Openings and Labor Turnover Survey (JOLTS) reported on Wednesday, the number of job opportunities for American workers increased to 10.1 in April, pushing the jobs-to-unemployed-workers ratio to 1.8x, significantly higher than the 1-1.2x range considered by the Fed to properly balance the US labor market. Friday’s report of BLS monthly nonfarm payrolls delivered a bigger blow to inflation doves, jumping by 339,000 in May and crushing economists’ forecast of an increase of just 195,000 jobs for the month (see below). This was the 14th month in a row that jobs added topped projections. Interestingly, the so-called ‘household survey’—another means by which the BLS measures employment—diverged for the month, showing a decrease in employment of 310,000 jobs, which explains why the unemployment rate rose from 3.4% to 3.7% in the face of climbing payrolls (economists predicted an unemployment rate of 3.5% at month end). Nevertheless, our survey of initial reactions by investors and economists indicate markets saw the full array of numbers last week as depicting a job market somewhat hotter than expected.

Equity investors see a silver lining in hot jobs numbers
The data described above and the fact that stocks staged a big rally on the back of Friday’s BLS report—the Dow had its best one-day gain since last November—raise a natural question: If labor markets still look tight, why did stocks respond so positively? Strong jobs data represent a double-edged sword. On the one hand, indications of a stronger economy increase investors’ hopes at the margin that the Fed might pull off an elusive ‘soft landing’ and get the US past its recent bout of inflation without a recession. On the other hand, the Fed has made it a clear objective to crush inflation, and a hot labor market doesn’t necessarily scream “mission accomplished” on that front. Along those lines, we note that after Wednesday’s JOLTS release, stocks briefly declined before recovering after two top Fed officials hinted the central bank would refrain from raising rates at their June FOMC, showing the power of Fed policy inferences investors glean from jobs data.
Labor market strength makes more hikes likely
That said, judging by Fed funds futures in the wake of Friday’s statistics, investors seem keen on a bigger economic buffer against recession, even if that means future Fed hikes, with the market-implied odds of a June hike popping from 25% to 45% after the BLS report. What should one make of this: a market looking for any reason to believe Fed tightening is finished, but happy to rally higher still when economic data suggest otherwise? Our view is that even against the backdrop of labor market strength, a recession is quite likely at this point, and even if May jobs data weren’t enough to trigger a rate increase in June, we don’t see the numbers helping convince central bankers to extend a possible pause through July. Needless to say, none of that should come as welcome news to equity investors and we remain cautious on risk assets as long as US economic strength is attended by inflation so high above the Fed’s target.
Digging deeper, jobs data are…pretty messy
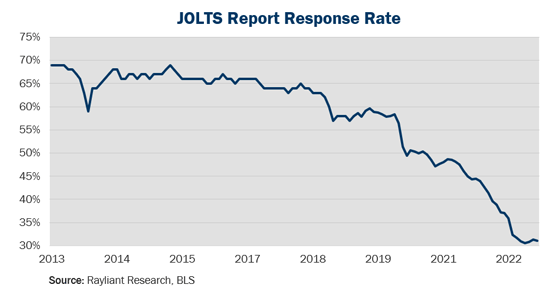
It will come as little surprise that for those willing to get into the details, there’s a lot more to the science of labor market statistics than one gets from jobs report headlines. One nuance that numerically inclined consumers of BLS data have noted in recent years is one of the inevitable human challenges to the process of tabulating employment data: Simply put, it’s become increasingly hard for the BLS to convince anyone to respond to their surveys. That lack of responsiveness naturally calls into question the representativeness and validity of the statistics investors and policymakers are using to make some very high-stakes decisions. Particularly troubling has been data collection for JOLTS, mentioned above, as response rates have fallen from nearly 70% a decade ago to just above 30% at the end of 2022 (see below).

According to research by Goldman Sachs, the resulting small samples have made JOLTS releases noisier, with the report’s monthly standard error almost doubling since 2013. On top of that, Goldman’s research suggests sampling distortions resulting from companies with hybrid or work-from-home arrangements could be significantly inflating job openings estimated from the report. Such issues explain why—as will be obvious to our readers—we’re inclined to pull data from so many sources and spend so much time thinking about what those numbers actually mean for our clients’ investments. It’s also obvious to us that as long as governments are publishing statistics, there will be job openings for economists with enough patience to carry on the dismal science.
You are now leaving Rayliant.com
The following link may contain information concerning investments, products or other information.
PROCEED