
It is a sign of the difficulty disentangling vice from virtue that two of the shiniest examples of the clean new world, Apple and Tesla, were also two of the first victims of power cuts arising from China’s struggle to source essential coal. Humour aside, this raises critical issues: the new era of great power rivalry, inflation, and market valuation.
When Russia committed suicide with perestroika in 1991, US GDP ($6.2tn) was 12x the size of Russia’s and 7x China’s. Now it is Pax Americana that is tottering, and China is in fine fettle. China represents 16% of World GDP, the US 24%. This makes the asset allocation decision with respect to China easier. Mr. Xi is unlikely to throw away the gains of the last few decades on hot wars with Taiwan and other neighbours, at least not until he has developed the technology and production capacity to replace western semiconductor manufacture. The US has a strong hand. It controls the international payments system, has a technology, military, food and energy resource lead and a huge import market. Together with allies, it commands 60% of World GDP. China has more up its sleeve. It has cornered the clean energy supply chain and is on the verge of creating a digital currency that will block US sanctions via Swift. Xi has centralised vertical power for a reason. He is remoulding Big Tech, boosting Party legitimacy by changing the way wealth is generated. The aim is to transform factor productivity, allowing smaller enterprises to prosper using the nation’s deep technology stack. As China lets the steam out of its property sector, it is clear there is a shift to a new model led by hard tech. In many areas, the West is years behind and the US is right to fear loss of hegemony. An added attraction is that China is not reliant on the Magic Money Tree. Xi’s “Common Prosperity” strategy shows he takes the interests of China’s equivalent of the “median voter” as a serious constraint.
Worldwide, median voters have not been well served by lockdown as global supply chain issues force energy, food, and many other goods’ prices higher. While headline CPI rates are still in the 3-5% range, energy inflation is near 20% due to resource shortages everywhere you look. Even in the US there are winter blackout warnings. China’s coal-fired power plants are caught between price regulation and soaring coal costs, as drought hits hydro power. Poor energy strategy decisions over many years in Germany and Britain are coming home to roost. As Buffet says, “You see who is swimming naked when the tide goes out.”
The bottleneck crunch should work itself out, despite central bankers stretching the definition of “transitory.” Every sector is different, some products spiking in both directions, with others on a slower burn. For example, UK house prices have risen 25% but rents have barely moved, a situation in danger of seeping into CPI given wage pressures. It is in lingering second-order effects that risks lie. The UK labour market has Brexit distortions and public sector political pressure, while the US has an 8 million job output gap. The IMF has called for central banks to get ahead of the curve if prices rise too fast or economies overheat, even without full employment.
Between bond yields peaking in 1982 and the 2008 GFC we lived in a deflationary regime. This changed with the GFC. Aversion to the deflationary impact of globalisation ushered in Brexit and Trump. China will not emerge again, and India has missed the boat. Baby boomers are leaving the workforce, female labour participation is flatlining and digital technology is diffusing at a sedate pace. Lockdown just pumped a triple monetary, supply, and demand shock into a system no longer proof against inflation.
How bad is inflation for investors? The record seems to show that inflation rates above 4% or 5% impact equity returns. This is attributed to companies not being able to fully pass on costs to customers, hurting profits and valuation multiples. But it is also likely the harm is caused by interest rates hikes to quell inflation hitting growth and discount rates, and scope for such rises is limited.
Which brings us to equity valuation. Where are we as we near the end of the monetary expansion that has fuelled the rally? Most ratios are bad guides to market direction. One or two measures, like q, (the ratio of the S&P’s market cap to the replacement value of net assets) and CAPE (the Cyclically Adjusted P/E ratio) have a better record. Today, the Fed q stands at around 2x, which is high, while CAPE suggests 45% overvaluation. But this does not allow for the monetary background. Taking the broad US equity market against liquidity, the Willshire 5000 Index divided by M2 money supply, the measure is high, but not extreme. In the late 1990s, the ratio peaked around 3x, while today it sits at just over 2x. With inflation at 5%, interest rates at 0%, it is easy to see this as reasonable.
Looking at markets in more detail there are a surprising number of realistic value opportunities. With rising energy and material prices many miners look cheap, banks are a yield pick-up play and there are property REITs with low debt and index-linked rental income. Even the mature tech giants tick the right boxes: market dominance, cash rich, high margin, and pouring money into innovation. Google may spend more on quantum computing R&D than China. China itself, the Saudi of data, is bristling with well-capitalised advanced technology stocks. As to the seeds for the next generation of giants, one of the lessons of our oil and gas price spikes is that clean energy investment needs to intensify. Space, AI, energy storage, quantum computing are other areas sucking in speculative capital at scale.
Equities
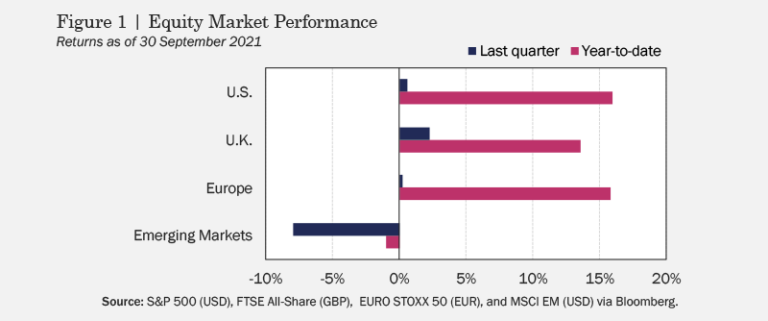
US equities racked up gains through August on strong earnings and favourable guidance from the Fed, before retreating late in the quarter on inflation worries and Fed talk of tapering, along with Biden’s stalling fiscal stimulus plan, to end up 0.58% for the quarter (see Figure 1). UK stocks added 2.2% on the back of solid earnings, while European stocks were effectively unchanged in Q3, gaining just 0.22%, as lifting of COVID restrictions based on high vaccination numbers were offset by spiking energy prices, supply chain issues, and inflation fears. EM stocks were the outlier in Q3, declining –8.0% as a number of countries dealt with COVID outbreaks and supply chain headaches, China kicked off a wave of regulatory interventions while struggling under power shortages, and the collapse of major property developer Evergrande prompted fear that a slowing Chinese economy might ripple through other emerging markets.
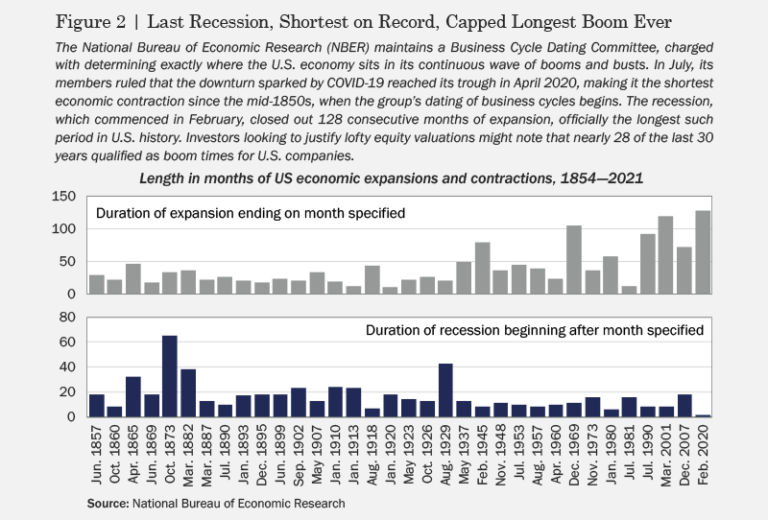
At the end of the third quarter, the rally taking place in global equities since the depths of March 2020 felt like it might finally be losing steam. Increasingly stretched valuations met with continued data of persistent inflation, bringing the expected timeline for rate hikes forward, while manufacturing and shipping disruptions—familiar to anyone buying a car, an appliance, or any random household item, for that matter, in the last year—threatened the post-vaccine resumption of global growth. On the other hand, bulls had plenty of reason to believe September was a mere speed bump, with economists concluding last year’s recession, lasting just two months, was the shortest in US history (see Figure 2), while good corporate earnings news provided micro-level support for the “economic revival” narrative. Indeed, according to research platform Sentieo, in addition to frequent “congratulations” by sell-side analysts joining August earnings calls, the phrase “great quarter” tallied a record 327 appearances.
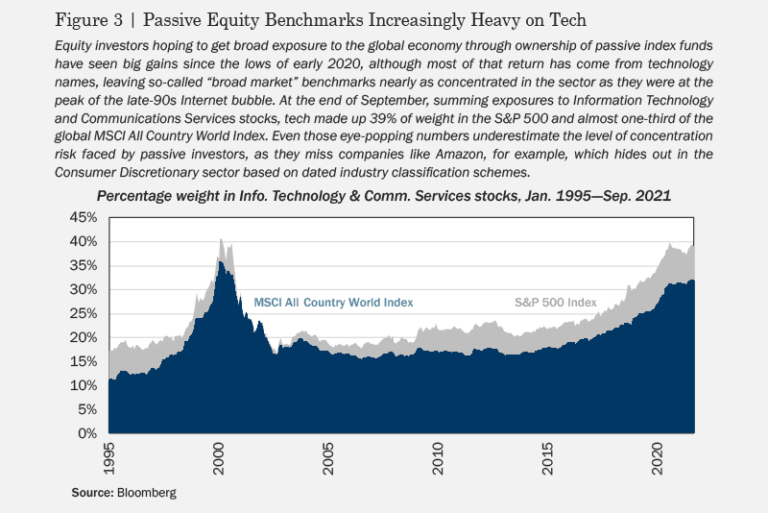
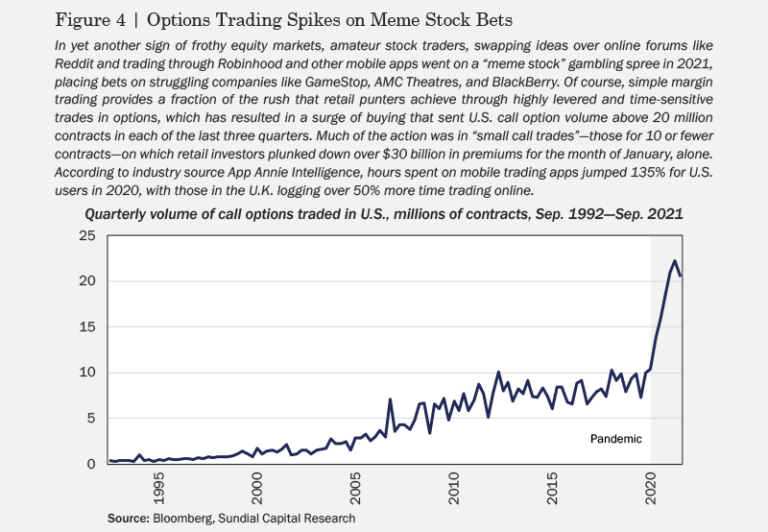
Even many equity bulls would likely acknowledge that outsized stock returns have created a number of pitfalls in today’s market. At the sector level, a large part of stocks’ gains—particularly since the onset of “stay-at-home”—have accrued to technology firms, with major benchmarks becoming increasingly heavy in tech shares, exposing passive investors to concentration risk on par with that observed at the height of the 1990s Internet bubble (see Figure 3). Within sectors, a surge in trading activity among amateur retail gamblers (see Figure 4) has pushed companies with suspect fundamentals to valuations so high that their overvalued shares have become meaningful components of large-cap equity benchmarks. One implication of this heightened risk to passive portfolios is the increased usefulness of active strategies, engineered not only to deliver truly diversified exposure at the level of geographies and industries, but also to exploit mispricing at the level of individual stocks.
Fixed Income
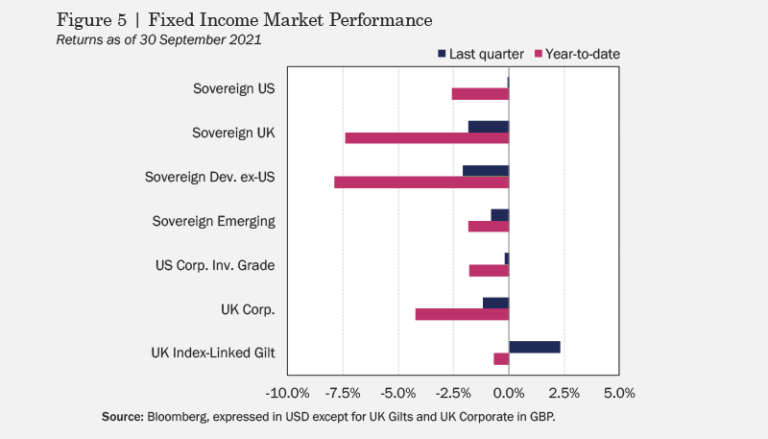
Perhaps reflecting the uncertainty among bond market participants as to transient vs. persistent inflation and when rock-bottom rates might finally begin to rise, fixed income reversed course once again in Q3, with most bonds losing ground over the last three months (see Figure 5). Rates initially fell in the third quarter, as headwinds to economic growth gave investors hope of a reprieve from tightening. By quarter-end, central banks had generally shifted to a more hawkish footing, moved by data suggesting rising prices observed in 2021 might not soon abate (data not lost on investors in index-linked bonds, who bid prices higher in Q3, producing positive returns for debt with an embedded inflation hedge).
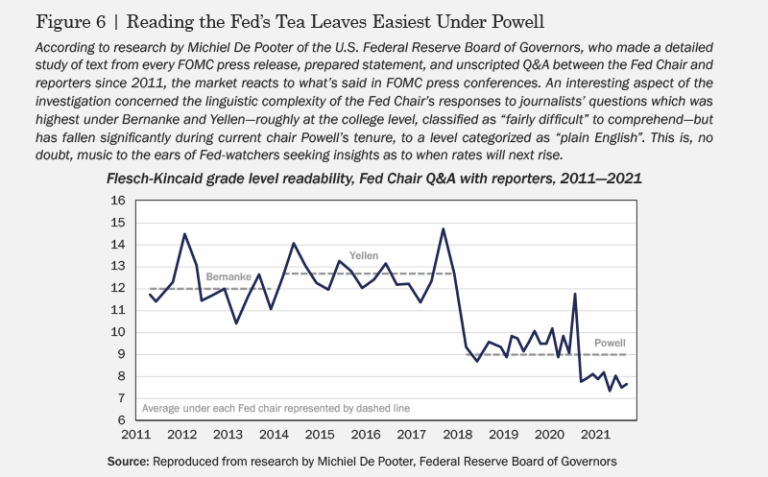
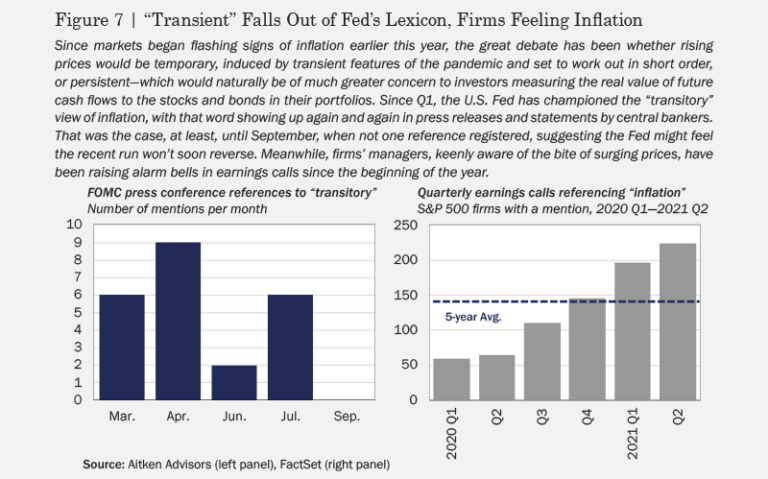
Investors seeking to time the inflection point for monetary policy have increasingly focused on the language of the Fed, parsing bankers’ speech in an attempt to gauge a change in sentiment, to the point that FOMC press conferences move markets and produce troves of linguistic data for industry and academic researchers to dissect (see Figure 6). In the spirit of hanging on Fed officials’ every word, it’s interesting to note that the economic buzzword du jour, “transitory,” an unusually popular term in Fed dispatches since the first quarter, suddenly fell out of use by the FOMC in September—though “inflation” has been rolling off the tongues of managers on corporate conference calls at an increasing clip throughout the year (see Figure 7).
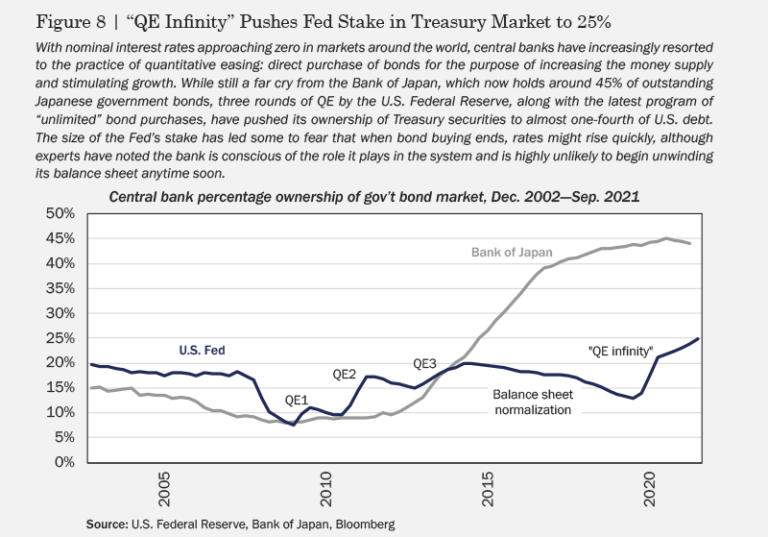
Norway became the first G-10 nation to hike rates in September, raising its policy rate from zero to 0.25%. Even without explicitly raising rates, given the size of central banks’ balance sheets in the wake of long-running quantitative easing programmes (see Figure 8), the spectre of an end to banks’ bond buying represents a source of anxiety for fixed income investors. To that point, ECB President Christine Lagarde recently pledged to slow the pace of emergency bond purchases, with a call for similar scaling down of QE by officials at the Bank of England. By the end of September, even the US Fed had announced that tapering was on the table, triggering a selloff in Treasuries at quarter-end.
Commodities
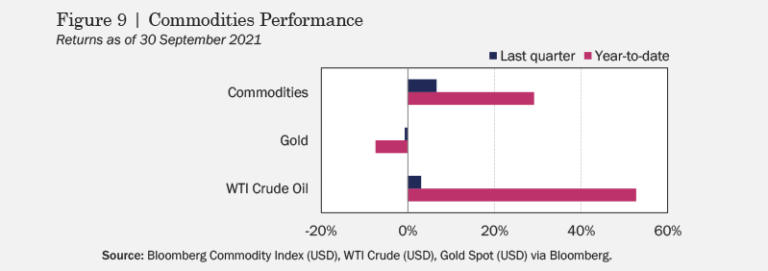
Commodities continued a record run in Q3, with the Bloomberg Commodity Index rising 6.6% for the quarter, placing its year-to-date return at nearly 30% and marking an historic high for the broad basket of energy, agricultural, and metal commodities (see Figure 9). Energy led the way, as the global economic recovery boosted demand and a confluence of factors held down supply, while disruptions to global transportation and supply chains—including a dire shortage of shipping containers—prompted a rally in coffee prices (see Figure 10). Precious metals declined for the quarter, as the value of commodities like gold, silver, and platinum as inflation hedges lost out to the fear of rising bond yields, which increase the opportunity cost to holding metals.
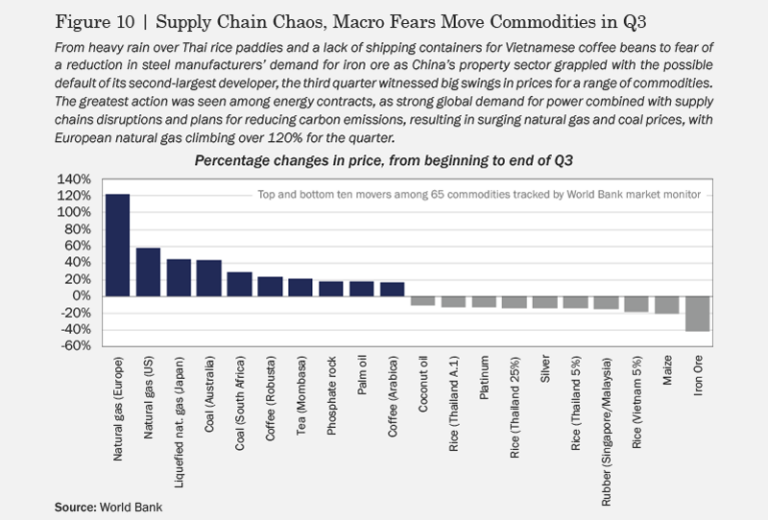
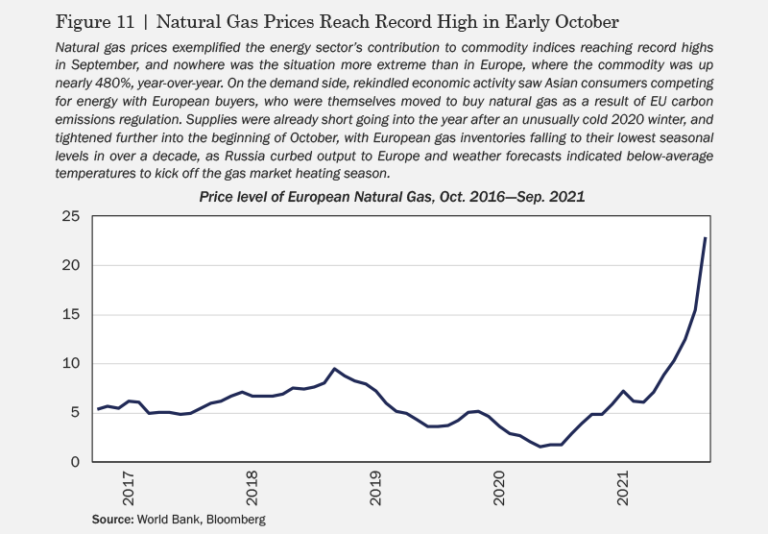
Iron ore was the biggest loser among commodities tracked by the World Bank, as signs of slower growth in China and the woes of property developer China Evergrande sparked concern that the nation’s steel industry would demand less of the industrial metal. European natural gas turned out to be the biggest winner by a wide margin, climbing nearly 480%, year-over-year (see Figure 11), benefiting from increased demand as countries with mostly vaccinated populations lifted COVID restrictions, EU carbon emission rules increased the commodity’s value relative to other energy sources, and coal-starved Chinese firms dipped into European production. At the same time, a cold 2020 meant inventories were already low coming into this year’s heating season, with Russia’s likely political move to curb supply to Europe creating conditions perfect for a September rally in natural gas.
The threat of high interest rates is not a done deal. Central banks are constrained by high levels of debt, sovereign and private. The US had been doing a good job of running down private sector debt from 2008, substituting state borrowings that, but for COVID, would now be reducing. Indeed, the US may be the only country able to sustain aggressive rate rises with impunity. This would support the Dollar, even with President Biden’s ambitious spending plans.
How will the world deal with its 300% debt-to-GDP ratio? Inflation seems to be the preferred option for now, as politicians “level up” to increase wages and create huge spending programmes labelled “investment.” Rebuilding local production capacity is another opportunity for state spending largesse as is green investment. But there will be plenty of investment opportunities for those who can avoid capital misallocation. Ultimately the switch to green should feed across sectors, a recent Oxford study calculating the benefit at $26 trillion, over a quarter of world GDP, as energy costs halve from 4% to 2% of GDP. Developed world savings ratios are at record levels. If debt-constrained governments keep interest rates low, as inflation picks up it is this kind of story that could force cash to capitulate, pouring into equities and propelling them higher.
US equities and fixed income are still hovering around all-time highs, but as usual it remains an even bet which way they go from here. All assets are expensive in an absolute sense, but risk asset prices are easier to justify relatively, because the risk-free portion of returns is historically low thanks to decades of low inflation. Evidence from lockdown’s fiscal support programmes suggests that this has been a mistake—that the way to get economies moving is not manipulating asset prices with low interest rates, but putting money to work in ordinary peoples’ pockets. While a decade of QE has kept the markets happy, it has escalated the West’s inequality resulting from turning Emerging Markets in general, and China in particular, into the world’s low-cost manufacturing base.
Because of this misunderstanding, there is a risk of underestimating the effects of stimulus. Further, inflation is often a political choice, and now that it is brewing, it is easy to see the attraction to governments of reducing debt-to-GDP without the pain of austerity. In Revolution and Rebellion in the Early Modern World, Jack Goldstone asserts that a classic mistake historically has been for states to see inflation as a chance to raise covert taxes and fund pet projects, only to find inflation increasing costs more than it reduces debt. The dangers are widely recognised, with the IMF and several central bankers calling for action in November. Interest rate rises may hit sovereign credit so governments may need to pull other levers if they decide to control the inflation they have unleashed. Stand by for a bull market in administrative measures! In which case, low rates may allow equities further room to run.
Subscribe to receive the latest Rayliant research, product updates, media and events.
Subscribe
Sign upIssued by Rayliant Investment Research d/b/a Rayliant Asset Management (“Rayliant”). Unless stated otherwise, all names, trademarks and logos used in this material are the intellectual property of Rayliant.
This document is for information purposes only. It is not a recommendation to buy or sell any financial instrument and should not be construed as an investment advice. Any securities, sectors or countries mentioned herein are for illustration purposes only. Investments involves risk. The value of your investments may fall as well as rise and you may not get back your initial investment. Performance data quoted represents past performance and is not indicative of future results. While reasonable care has been taken to ensure the accuracy of the information, Rayliant does not give any warranty or representation, expressed or implied, and expressly disclaims liability for any errors and omissions. Information and opinions may be subject to change without notice. Rayliant accepts no liability for any loss, indirect or consequential damages, arising from the use of or reliance on this document.
Hypothetical, back-tested performance results have many inherent limitations. Unlike the results shown in an actual performance record, hypothetical results do not represent actual trading. Also, because these trades have not actually been executed, these results may have under- or over- compensated for the impact, if any, of certain market factors, such as lack of liquidity. Simulated or hypothetical results in general are also subject to the fact that they are designed with the benefit of hindsight. No representation is being made that any account will or is likely to achieve profits or losses similar to those shown. In fact, there are frequently sharp differences between hypothetical performance results and the actual results subsequently achieved by any investment manager.
You are now leaving Rayliant.com
The following link may contain information concerning investments, products or other information.
PROCEED