
Equity investors did not need to head for the snowy heights over the year end break. The heights came heading straight at them in a truly monster Santa Rally. This capped a year in which the S&P 500 added over 30% from the depths of a capitulation sell-off on Christmas Eve 2018.
Much of the credit for 2019’s performance belongs to the Fed, generously pumping $100 billion into the system every month, but kudos too to quoted US companies, whose $600bn of share buybacks has been a force to “enhance” earnings and assets per share. Cash earns so little that treasurers can hardly get rid of their exponentially growing money piles fast enough, and buybacks give an instant sugar rush. Here we face a “fallacy of composition” situation, where what is good for one unit is not good for the system as a whole. It goes well beyond buybacks, as listed stocks themselves are heading towards endangered species status.
More companies are being taken private or absorbed by larger peers than are replenishing markets via IPOs, and similar patterns are seen in Europe and the UK. According to Dealogic, US listings are down by a fifth to 1,237 and in the UK funds raised in a mere 37 listings dropped by half to £3.7bn year on year. Over the last two decades, the number of listed US companies has halved and in the last year in the US, S&P 500 buybacks and dividends together reached almost 100% of operating earnings. So, it is no surprise real economy investment and innovation are thin on the ground.
The main culprit is low interest rates. The lower the discount rate, the higher the valuation—and herein lies the secret of the market’s post Global Financial Crisis rise and the weakness of so-called valuation methods which ride lockstep with momentum. Although investors have enjoyed the ride, the more thoughtful have been concerned about this environment and what lies beyond the next loop of the roller coaster.
Of course, this misses the whole point of roller coasters, which is to keep going as fast as you can.
There are certainly plenty of things keeping momentum in place. Not least, the US Fed appears to have trouble ending QE, and needs to explain how it is going to reduce its balance sheet painlessly. In China, with debt now at 3x GDP, the China Banking and Insurance Regulatory Commission welcomed in the new year by opening its financial sector to outside investors as from January 2nd, when the Peoples’ Bank of China also cut domestic reserve requirements by 50 basis points. CBIRC is relaxing foreign shareholder limits and cancelling total asset requirements for foreign financial firms. Large banks are queuing to enter the giant market and new competition is likely to lead to consolidation of small players and improve terms for customers. But the moves are still way short of a level playing field for foreign competitors with, for instance, poor redress mechanisms against confiscation of assets.
Phase one of the US-China trade pact was signed on January 15th, de-escalating the tariff war, with the US cancelling $160 billion (out of $360 billion) of tariffs on Chinese toys and smartphones, and China committing to buy more agricultural goods and improve intellectual property rights. China Beige Book calls the deal “a head scratcher” with unachievable purchase numbers and timelines, a baby trade deal and unlikely to address the uncertainties slowing investment and growth. Will it come unstuck before the November US Presidential election?
Speaking of which, we note that the S&P has only seen negative returns in four of the twenty-three election years since 1928. Professor Marshall Nickles, in his 2010 paper “Presidential Elections and Stock market Cycles,” and Yale Hirsch of the Stock Trader’s Almanac have proposed strategies to take advantage of late-cycle performance. But this would not have worked for Obama, whose early years were very profitable, and may not work for Trump, whose first year was up 30%. Despite this, we can be pretty confident Donald Trump will now be doing his utmost to keep the market flying. China is probably off the hook for now and, given the strength of its hand, maybe longer.
It is Europe that is currently attracting tariff threats as it dares tax US tech giants. It is also heading into 2020 in the teeth of a worsening manufacturing slump as it bids farewell to one of its strongest performing members. But as the last couple of weeks in the Middle East show, events change very fast and investors trading politics get whipsawed.
What is to be done? Well, the answer lies in the one part of the equation that is genuinely manageable—the investor. Only the individual can answer questions like “What are my objectives?”, “How well do I sleep at night when the market is falling?”, and so on. The adviser can help the investor arrive at sensible answers to these questions because, although we may not be able to predict market moves with precision, we do know in general how they behave over time.
Admittedly, things are not made any easier by tectonic changes in the real world. Questions like “Will the city I have lived in all my life be under 30 feet of water when I retire?” do not appear in most financial advice training courses, but do seem reasonable when you read that insurers are disinvesting from fossil fuels in order to protect their shoreline property portfolios from rising sea levels. They are also removing low-cost legacy competitors from the path of their latest clean energy assets.
While dispute rages on the origins of climate change, the blame for the deeper disruption of digitalization lies entirely with humans. Along with the impact on productivity of low interest rates, the rise of vast digital empires with pan-continental or global reach has contributed to a polarization of wealth that is another source of real-world destabilization and uncertainty for investors.
Along with this destruction, these alien forces are creating huge concentrations of value and opportunities for investment gain rippling through entire sectors. The disturbances we see around us should not deter long-term investment, as new ideas feed through into markets. Deeply unsettling technologies and social conditions lay the base for the next stage of growth, a positive note for the coming decades.
Equities
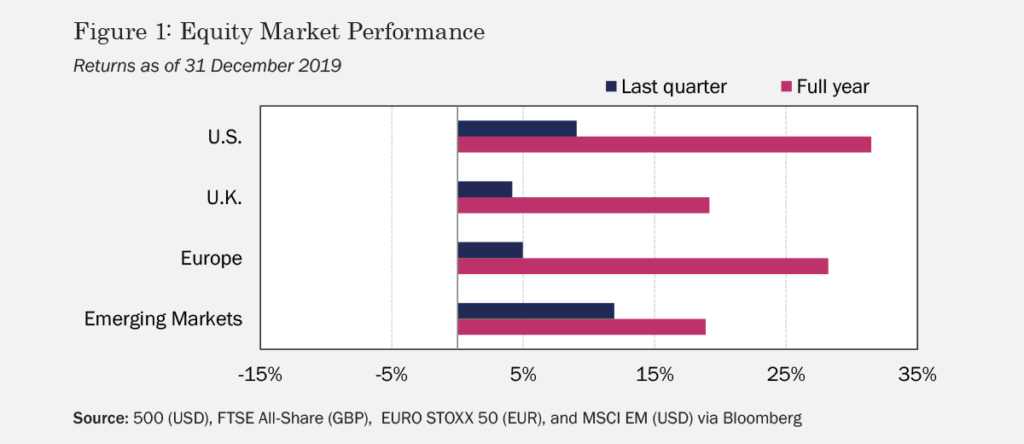
The fourth quarter was a fitting conclusion to a strong year for global equities, with stocks in developed and emerging markets reaching new highs to close out 2019. EM stocks led the way, up 11.9%, followed by US shares, which rallied by 9.1%, then European and UK equities, which added 5.0% and 4.2%, respectively, in Q4 (see Figure 1). In a year that many observers thought would witness continued rate hikes and a reduction in central banks’ balance sheets, late-2018 market losses prompted a sudden switch to accommodative monetary policy—including a third rate cut in October—pushing stocks ever higher in 2019. On the political stage, the planned signing of a “phase one” trade agreement lifted US and EM stocks, while a landslide victory in December by Britain’s Conservative Party seemed to resolve uncertainty around the timing of Brexit, boosting shares in the UK.
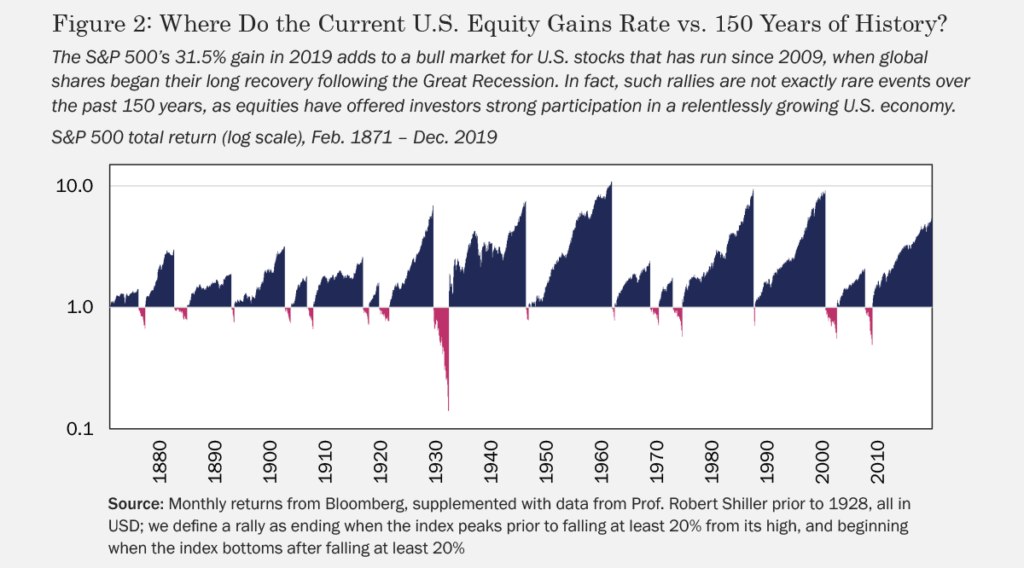
Of course, 2019’s gains only add to global equities’ record-breaking run since markets pulled out of the Great Recession just over a decade ago. With each announcement of a new all-time high, investors may be forgiven for wondering whether there are natural limits on a bull market’s length. Looking back on over 150 years of data on US stocks, one finds that such streaks aren’t without precedent, giving the longs reason to hope that markets have room yet to rally in 2020 (see Figure 2).
That said, a decade of positive returns has priced shares on the expensive side, and there are plenty of things to keep investors awake at night as we enter the new year. Manufacturing data continue to be relatively weak throughout the world, and although the US reported solid GDP numbers in Q3 and positive recent jobs data—including the lowest unemployment rate since 1969—US corporate earnings have been essentially flat and might well remain so into 2020. And while a US-China phase one deal represents progress, it also leaves much to be solved and serious damage may already be done (e.g., the IMF estimates we’re already in for a US$700 billion hit to global GDP by the end of 2020). Likewise, while Boris Johnson has passed the legislation to leave
the EU by the end of January, uncertainty still surrounds transition-period negotiations that will dictate the ultimate form Brexit takes and its implications for the nation’s economy.
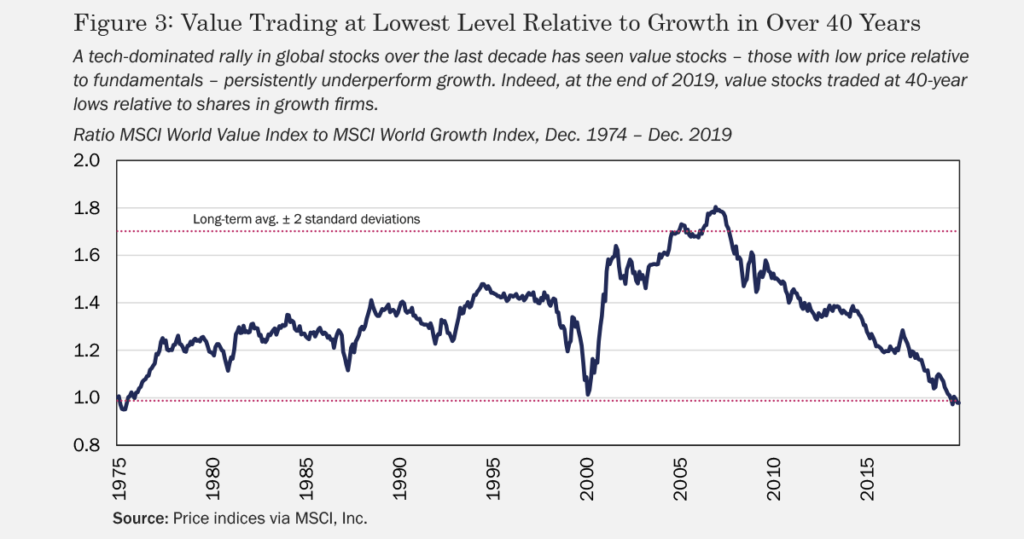
It’s worth noting one corner of the stock market that could stand to benefit from a reversal of fortune for global equities: the portfolio of value stocks with low price relative to fundamentals. Throughout the tech-dominated rally of the last eleven years, value has persistently underperformed growth, leading to relative prices not observed in more than four decades (see Figure 3). In fact, waiting for a turnaround might be rewarding in and of itself, as shares in the MSCI World Value Index featured a dividend yield of 3.4% per year at the end of 2019, versus 2.3% per annum for stocks in the standard MSCI World Index, and just 1.2% per year for stocks in the MSCI World Growth Index.
Fixed Income
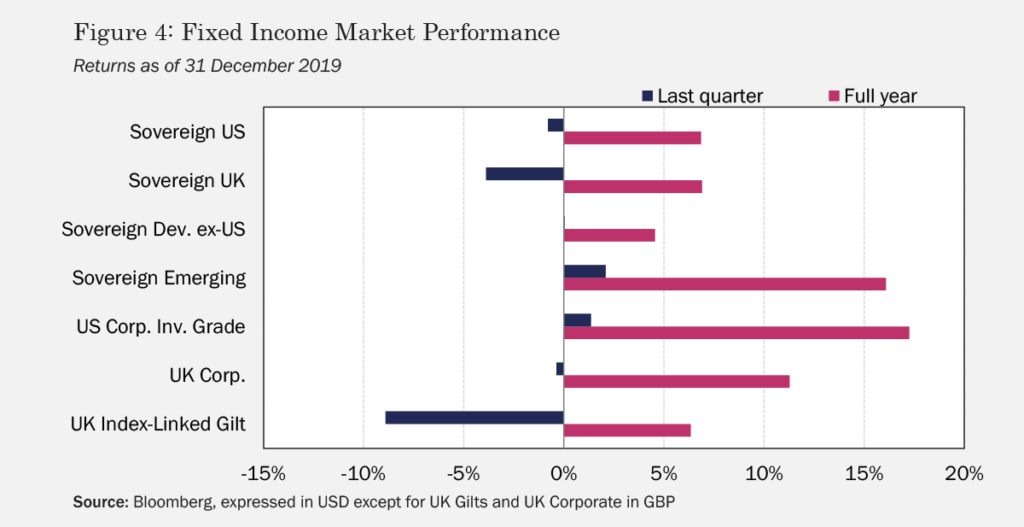
Central bank easing and investors’ heightened risk aversion on fears of a downturn and mounting geopolitical tension served to push bond prices higher for most of the year. By contrast, in the fourth quarter, yields held steady or climbed and prices fell for sovereign bonds across developed markets on modestly better-than-expected macro data and positive sentiment surrounding the aforementioned progress in trade talks between the US and China (see Figure 4). UK gilts were hit especially hard at the end of Q4, shedding –8.9%, as the market reacted favorably to the victory by Conservatives in December’s election. US corporates and sovereign EM bonds posted positive returns on the quarter, as investors’ optimism spurred a greater appetite for risk, leading them into higher-yielding issues.
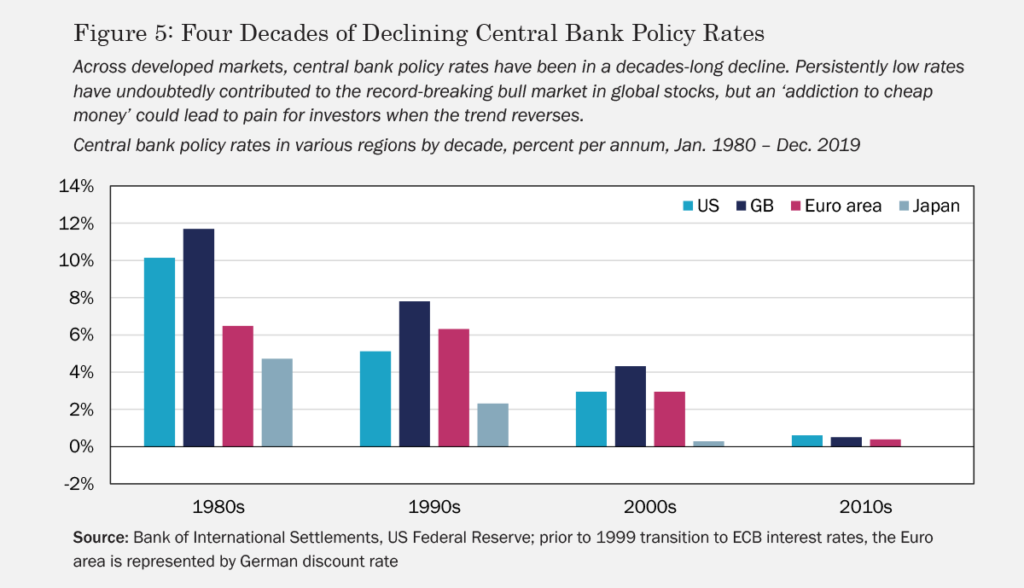
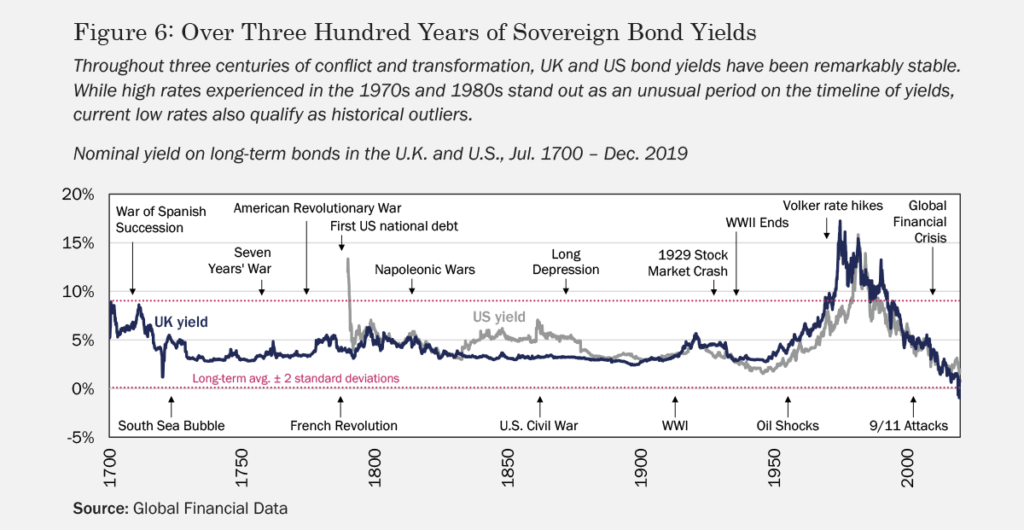
The pullback in sovereign developed bond yields to close out 2019 runs counter to a downward trend in rates that has persisted for over four decades across developed markets and which has become particularly acute in the last ten years or so since central banks began a coordinated policy response to the Global Financial Crisis (see Figure 5). Zooming out in the UK and the US—where long-term yields are available for study over a very long horizon—we find that although high interest rates experienced in the 1970s and 1980s were clearly an aberration, even on time scales spanning several centuries, we’re living in a time of unusually low rates (see Figure 6).
Of course, if rates are low, prices must be high, and that could spell trouble for fixed income investors going forward. As was the case with equities, we might question whether bond prices could possibly be discounting a range of risk factors, from slowing growth and geopolitical problems to the potential that long-dormant inflation suddenly rears its head. To make matters worse, with rates so low for so long, investors’ drive for yield has resulted in razor-thin corporate credit spreads that could blow out if economic conditions deteriorate, earnings decline, and defaults rise.
Alternatives
Among commodities, oil performed remarkably well in 2019, adding 12.4% in Q4, and returning 52.8% for the full year (see Figure 7). On the supply side, production cuts announced by OPEC+ for the first quarter of the new year helped considerably, while positive macroeconomic data and optimism around the phase one US-China agreement contributed to stronger demand. Gold returned 3.0% in Q4, closing the year with a gain of 18.3%. As a safe haven asset, gold has benefited throughout 2019 from investors’ fears of geopolitical risk and global economic contraction. Central banks have added to gold’s gains through rate cuts—which reduce the opportunity cost of holding precious metals—and through outright purchases of gold as a means of diversifying out of US dollar-denominated assets.
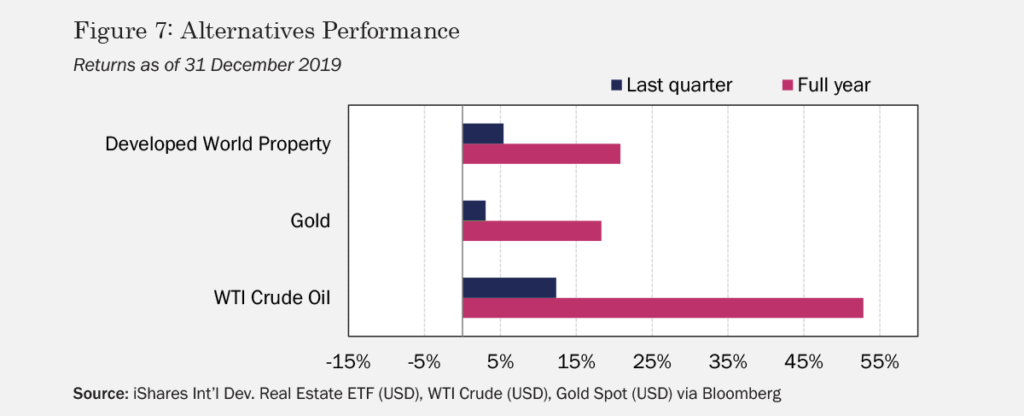
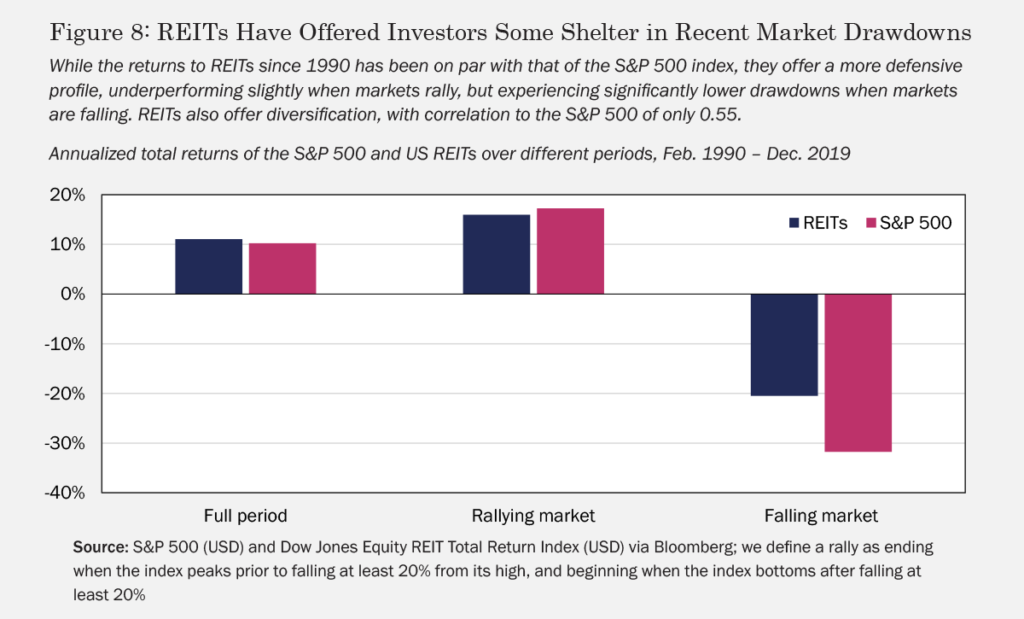
One final rate cut in October helped push REITs up by another 5.4% in Q4 to end the year with a 20.8% gain. Going into 2020, REITs don’t appear as attractive on price as they did at the beginning of 2019, but fundamentals still seem to broadly support current valuations. One argument made by proponents of REITs is that they represent a good investment for late-cycle and recessionary periods (e.g., because they tend to perform well in low-rate environments). Indeed, since 1990, US REITs seem to offer performance only slightly lower than that on the S&P 500 when the market rallies and perform significantly better during steep market drawdowns (see Figure 8). With a correlation to the S&P 500 of just 0.55 since 1990, REITs also appear to provide a meaningful benefit in terms of diversification.
Markets broke out of the range in which they had been bound for the second and third quarters of 2019, with the S&P 500 now trading 20% above the lows of March and June, equivalent to the amount by which last October’s all-time high exceeded the capitulation low of Christmas Eve 2018. Whether we see a retracement from here as the mixed results of the current earnings season kick in, or a continuation into euphoria territory as central bank easing continues is anybody’s guess. For what it’s worth, Global equity PERs at 20x are still well below the 35x reached just before the 2000 peak, and there remains a degree of aversion to risk assets so it’s entirely possible we could be witnessing the lead in to an explosive long term bull market top. Such peaks normally happen when everybody is fully invested. Meanwhile, President Trump’s impeachment is an interesting start to the final year of the current election cycle and along with other macro and political excitements promises plenty to engage investor fear and greed as we head toward November 2020.
Humans are generally very bad at outwitting markets, because each investor is only one individual and that individual is up against every other participant—a vast crowd betting the World’s money. But as individuals, those participants cope badly with the market in very similar ways. They underreact to some things, go crazy about others. They sell as soon as they make a profit, hang on to worsening losses, and so on. In fact, they make these errors in such characteristic ways that many of their mistakes have become quite well documented anomalies. Rayliant’s systematic research includes a focus on how much impact these anomalies have on stock performance, and on how reliably. Bundling such information in increasingly sophisticated ways, Rayliant are leading proponents of a multi-factor approach to investing.
The beauty of this for Henderson Rowe is that we are now able to use models developed and tested by Rayliant in our own stock hunting. Rayliant’s research has confirmed a number of our existing signals and provided us with many new ones. This means we can deploy them all with far more confidence than in the past. It is ironic that the confusion and bias of markets directly gives rise to such tools for systematic and disciplined investing.
Subscribe to receive the latest Rayliant research, product updates, media and events.
Subscribe
Sign upIssued by Rayliant Investment Research d/b/a Rayliant Asset Management (“Rayliant”). Unless stated otherwise, all names, trademarks and logos used in this material are the intellectual property of Rayliant.
This document is for information purposes only. It is not a recommendation to buy or sell any financial instrument and should not be construed as an investment advice. Any securities, sectors or countries mentioned herein are for illustration purposes only. Investments involves risk. The value of your investments may fall as well as rise and you may not get back your initial investment. Performance data quoted represents past performance and is not indicative of future results. While reasonable care has been taken to ensure the accuracy of the information, Rayliant does not give any warranty or representation, expressed or implied, and expressly disclaims liability for any errors and omissions. Information and opinions may be subject to change without notice. Rayliant accepts no liability for any loss, indirect or consequential damages, arising from the use of or reliance on this document.
Hypothetical, back-tested performance results have many inherent limitations. Unlike the results shown in an actual performance record, hypothetical results do not represent actual trading. Also, because these trades have not actually been executed, these results may have under- or over- compensated for the impact, if any, of certain market factors, such as lack of liquidity. Simulated or hypothetical results in general are also subject to the fact that they are designed with the benefit of hindsight. No representation is being made that any account will or is likely to achieve profits or losses similar to those shown. In fact, there are frequently sharp differences between hypothetical performance results and the actual results subsequently achieved by any investment manager.
You are now leaving Rayliant.com
The following link may contain information concerning investments, products or other information.
PROCEED