
Back in 2013, the Harvard Business Review published an excellent article by Tomas Chamorro-Premuzic, a professor of business psychology at University College London. The article, “Why Do So Many Incompetent Men Become Leaders?” made many interesting points. One of the key takeaways was this: The very attributes that lead to a manager being chosen are the same ones that make him a bad manager. This article was about managers of businesses, but the insight rings just as true for portfolio managers.
One of the most shocking revelations for business school students in a core management/leadership class is that lessons from the biographies of the most iconic business leaders are almost negatively correlated with the identified traits of effective leaders documented by academics in large-scale studies. Research shows that practices which lead to sustained and repeatable firm successes are humility, listening, adaptability, vulnerability and— importantly—openness.
It’s possible the ivory tower academics have no idea what they’re talking about. After all, biographies of Steve Jobs and Elon Musk might suggest that great leaders have all the answers, never doubt themselves, manically push forward despite conflicting evidence, are able to will an outcome into existence through positive thinking and—this one’s key—are comfortable making big bets. One imagines that if failed CEOs were also asked to write books you would find almost identical characteristics.
What is often true of people who are chosen for a senior leadership position is that they have previously made unreasonably large bets, driven by overconfidence. And those bets happened to pan out. The overconfidence allows them to take credit with enormous conviction for an outcome largely driven by luck. The very basis for their promotion to leadership—taking big risk due to hubris, taking credit for luck—is the same reason they fail as senior executives after ascending to that position.
The same is true of investment managers and the process by which they’re selected. Fund managers perched on top of last year’s performance rankings typically run heavily concentrated portfolios loaded with big industry and single-stock bets. Bottom performing managers, one finds, hold different stocks, but are identical in their risk-taking. If you interviewed both sets of managers, they would offer compelling and well-researched investment theses. Both would have enormous conviction and would eat their own cooking. You would have trouble deciding, ex ante, who would turn out to be right. All you would know is that given their conviction and their concentration, they must either become a positive outlier—and a top-performing manager—or a negative outlier and destroyer of client wealth.
Despite the strong similarities between top-performing and bottom-performing managers, human behavioral biases repeatedly drive investors to choose managers with the best recent performance. Much of the allure apparently stems from the myths such managers cultivate about themselves: stories of unwavering conviction in the face of significant volatility, of steadfast certainty in the trade. That’s a story that few investors can resist. But the very characteristics that lead to the selection of such managers—taking big risk due to hubris, taking credit for luck—ultimately doom these managers to be irresponsible stewards of client wealth.
Cathie Wood, manager of the Ark Innovation ETF (ARKK), is perhaps the most recent in a long line of investors anointed as the ‘New Warren Buffett’ for her performance since the pandemic began. Most investors would love to have allocated to her fund at the beginning of 2020 (and most managers would love the 30-fold increase in assets she enjoyed following that great performance). But the characteristics that made ARKK successful in 2020 played out quite differently in the following year, when the fund declined 50% from its peak, wiping out US$25 billion of clients’ assets in the process. Many of us will recall an older incarnation of the ‘New Warren Buffett’, John Paulson, proclaimed the investor of the century for betting against subprime mortgages just before the global financial crisis. He subsequently raised $32 billion in assets, then lost 70% of his investors’ wealth.
Wood and Paulson likely have many good qualities as portfolio managers—they are undoubtedly very skilled as entrepreneurs—and the point of these examples is not really to critique them as investors. Instead, we consider these cases to illustrate a shortcoming in the way individuals (and even sophisticated institutions) choose investment managers. Every portfolio manager has some kind of process, but what Wood and Paulson and most of the top-performing managers in any given year have in common—and the reason that they attract so much attention and such large inflows from new investors—is that their process was connected to a theme, and that turned out to be the theme of the year.
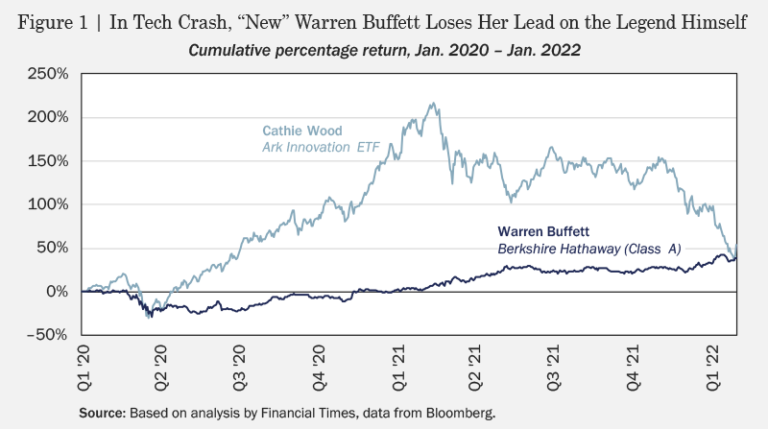
The Financial Times recently printed a wonderful chart, reproduced above, juxtaposing Cathie Wood’s performance since 2020 with that of “The Real Warren Buffett.” Both started and ended this period at roughly the same place, but investors would have a very different experience during the last two years depending on whom they chose. Choosing a good portfolio manager is about selecting those who deliver long-term outperformance as opposed to spectacular booms (most often before we invest) and spectacular busts (most often after). That requires proper acknowledgment of the role confidence and good luck play in any year’s performance, and a focus on process—the nuts and bolts of portfolio management—as opposed to short-term performance. (But if you have a line on the ‘New New Warren Buffett’, please let us know.)
Equities
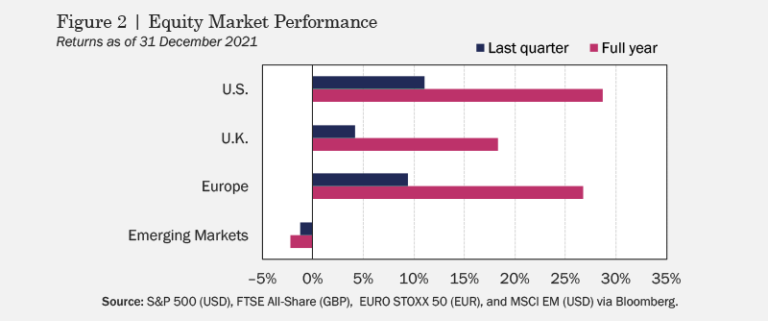
Developed market equities posted strong returns in the fourth quarter, shrugging off two big threats to global growth: accelerated tightening by central bankers concerned over accumulating evidence of persistent inflation and further disruption to worldwide economic activity due to the highly contagious Omicron variant (see Figure 2). Fear over the new strain sent stocks briefly tumbling in late-November, although the US market recovered and ended up 11% in Q4 on the back of robust earnings. UK stocks added 4.2% for the quarter, although results across sectors varied significantly, with those facing more exposure to COVID faring worse and heightened volatility in shares of businesses sensitive to rates as the Bank of England wavered over when to hike rates. Similarly, despite lockdowns to combat Omicron in a number of European countries, equities in the region climbed by 9.4% in Q4. Emerging markets fared worse, ending the quarter –1.2% lower, as US dollar strength combined with waning sentiment over inflation, geopolitical tension, and the latest COVID waves.
One beneficiary of strong equity markets over the last year has been companies’ managers, who took advantage of lofty valuations and investors’ strong risk appetite to offload a record amount of stock in 2021 (see Figure 3). In November, alone, insiders at S&P 500 firms dumped almost US$16 billion worth of their companies’ stock, with sales for the year reaching over US$60 billion, a 50% jump from 2020. Not surprisingly, much of the selling took place in high-flying tech shares pushing up index valuations over the last two years. Elon Musk liquidated over US$16 billion of his Tesla holdings in 2021, joining Google co-founders Larry Page and Sergey Brin, Amazon’s Jeff Bezos, and Meta’s Mark Zuckerberg, who all sold large chunks of stock during the year. In part, tech billionaires were motivated to sell shares ahead of potential adverse changes to US tax code. Companies also cashed in, issuing over US$150 billion in stock through IPOs in 2021, with speculative “blank-check” SPACs—shell companies formed for the sole purpose of buying private companies, a means of circumventing the traditional IPO process—accounting for a staggering US$160 billion of additional issuance.
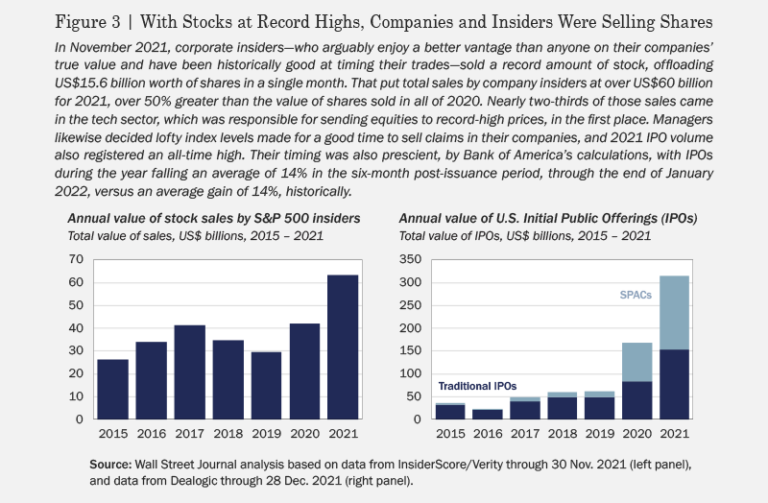
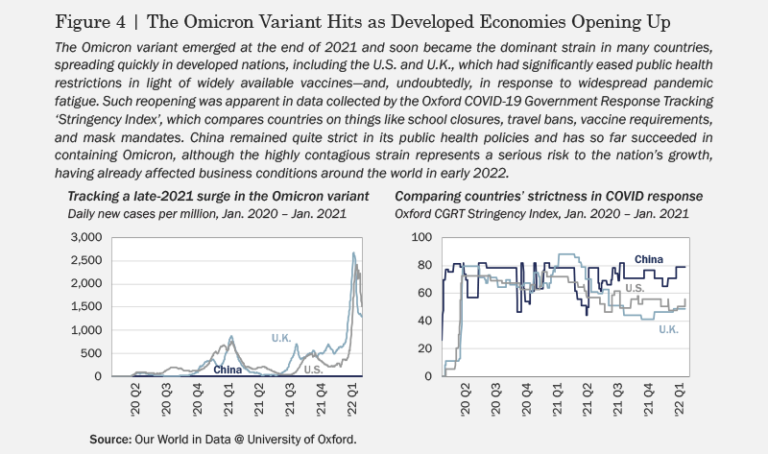
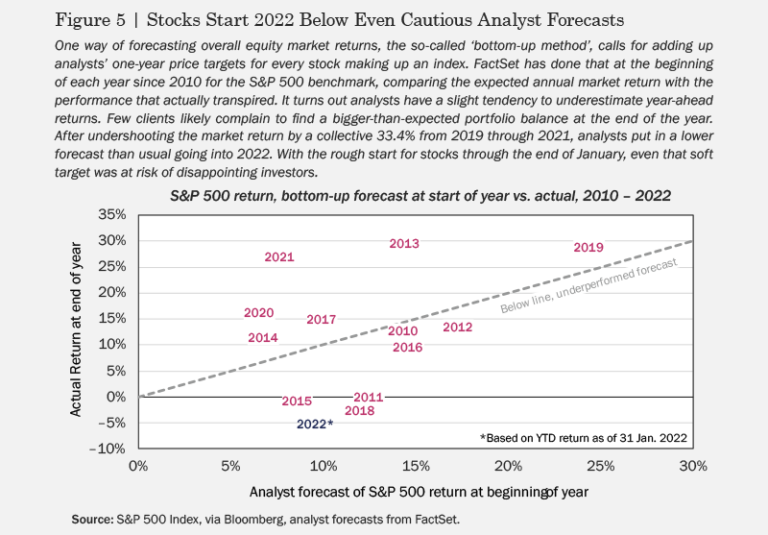
Such stock sales turned out to be well timed, as global equities turned down in the first month of 2022, with US shares hit particularly hard. The MSCI World Index, tracking developed markets, dropped by over –5% in January, as inflation pushed prices ever higher and the implications of Omicron for global economic activity became clearer. The most recent COVID surge, which began at the end of last year, struck at a time when developed countries, increasingly vaccinated—but also exhausted by a pandemic entering its third year—significantly eased public health restrictions (see Figure 4). Despite reassuring evidence that Omicron caused less severe illness than previous strains, an IHS Markit flash survey released at the end of January indicated more serious economic damage, with restaurants and other service-oriented businesses in the US falling from a reading of 57.6 in December to 50.9 in January—levels above 50 indicate economic expansion—the lowest reading in 18 months. The UK economy showed more resilience, according to the survey, although services lagged in the face of Omicron, offset by strengthening numbers in manufacturing. This rough opening to the new year put the S&P 500 on track to perform well below subdued forecasts implied by stock analysts’ December 2021 price targets, which predicted U.S. stocks to gain just under 10% in 2022 (see Figure 5).
Fixed Income
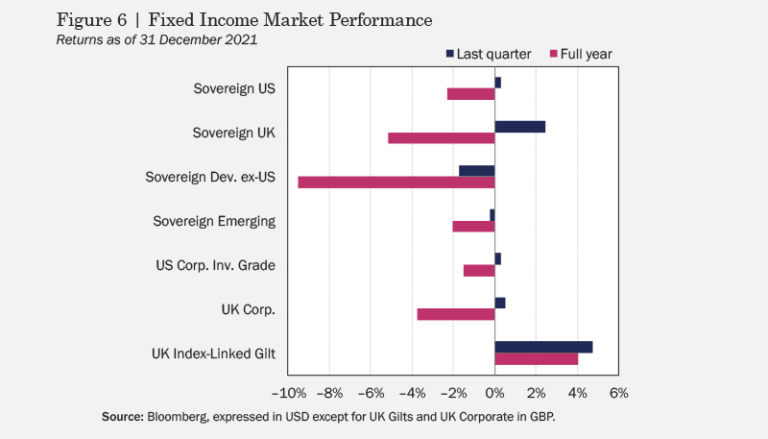
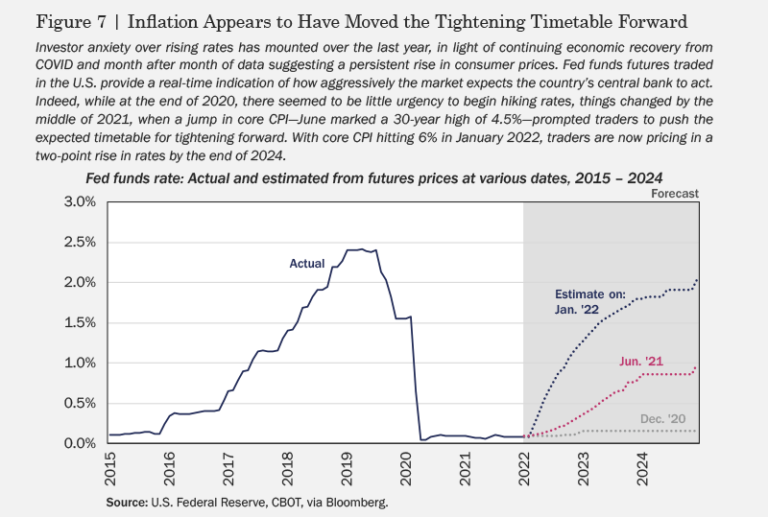
We remarked in our third-quarter commentary that US central bankers had casually stopped using the word ‘transitory’ to describe inflation. This was made official in late November, when Fed chair Jerome Powell told a congressional committee that he no longer thought the term was appropriate to describe the current inflationary environment. Global bonds were relatively subdued in Q4 (see Figure 6), as another round of alarming inflation prints during the quarter pushed policy makers to an increasingly hawkish stance, while Omicron’s emergence in November created uncertainty as to whether tightening would actually proceed. Not surprisingly, index-linked debt posted another solid return for the quarter. At the beginning of 2022, the CPI continued to come in red-hot—the January core CPI reading was 6%—leading traders to price in a two-point rise in rates for the year (see Figure 7).
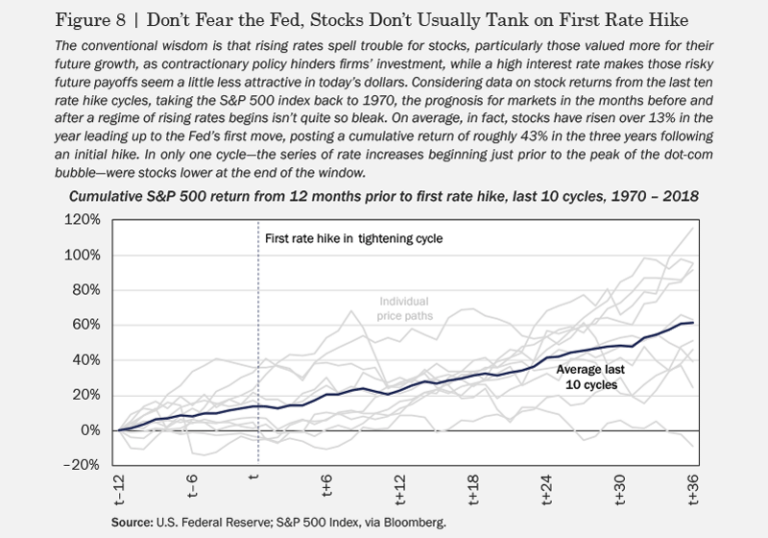
Bond markets tell us rates are headed up. What does this mean for equities? Over the last decade, “Don’t fight the Fed”—warding investors off of bearish bets when central banks are easing—has been a winning mantra during a period in which persistently low rates have given way to a long run of increasing valuations. The flipside, of course, is that when rates start to rise, investors should underweight stocks. Examining the last 10 tightening cycles, going back to the early 1970s, the conventional wisdom seems to fail (see Figure 8). In the 12 months prior to an initial rate hike, the S&P 500 has historically risen by more than 13%, on average, with cumulative returns in the three years subsequent to liftoff clocking in at another 43%. So, while there are things an investor might do to position a portfolio for success in less accommodative monetary policy regimes (tilting more toward value stocks, for example), exiting equities altogether hasn’t usually been the best response.
Commodities
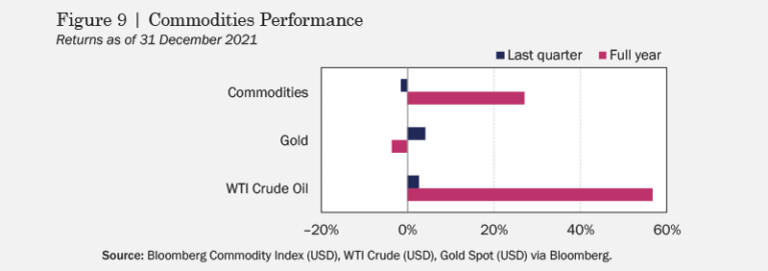
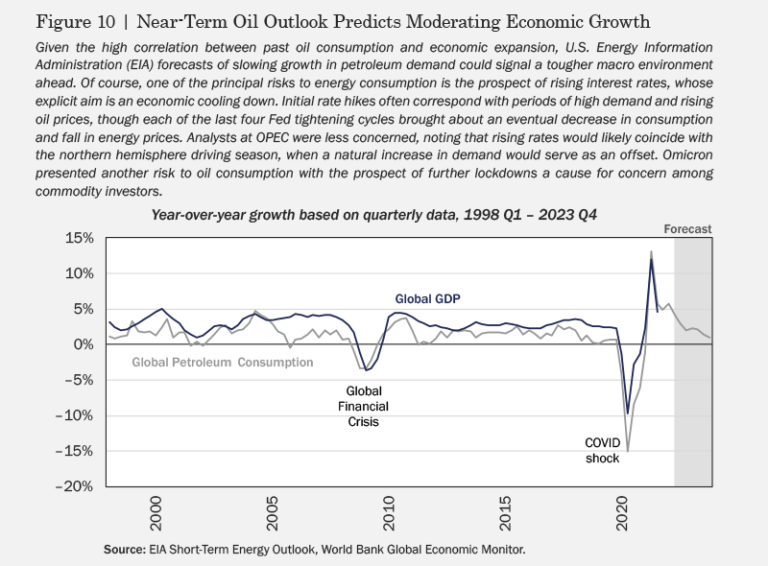
Commodity performance was also muted in Q4, as the Bloomberg Commodity Index gave back –1.6% for the quarter, ending the year up 27%, a few points off the prior quarter’s historic high (see Figure 9). The strong performance of both equities and commodities in 2021 reflected continued recovery in the global economy. Along those lines, industrial metals were among the biggest winners in the fourth quarter. Agricultural commodities and precious metals also posted gains for the quarter, with inflation fears seeming to dominate rising yields, pushing more investors into gold as a hedge against rising prices. Natural gas reversed sharply, while oil moved modestly higher. Despite a further increase in oil prices at the beginning of 2022 on declining US oil stockpiles and the prospect of a Russian invasion of Ukraine, economic growth over the next 12 months—and hence energy consumption and prices—faces risk on two key fronts mentioned at the top of this note: rising rates and further pandemic-related economic disruptions (see Figure 10).
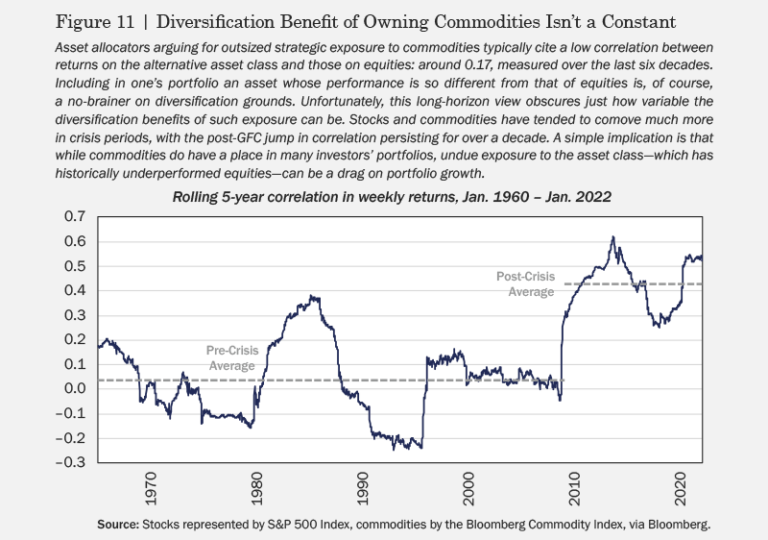
Commodities have performed as an effective inflation hedge throughout the last year, and that is one of the usual arguments for allocating to the asset class. A more general claim one sometimes hears is that the historically low correlation between commodities and equities merits their inclusion at large weight in a well-diversified global portfolio. Since 1960, the correlation between the S&P 500 and the Bloomberg Commodity Index has, in fact been very low, coming in at around 0.17. Of course, “full-sample” statistics don’t necessarily apply over any given horizon, and it turns out the diversification benefits of commodity exposure vary significantly depending on when one invests. Commodities and stocks exhibited lower comovement before the global financial crisis, with the correlation jumping to roughly 0.43 since 2009 (see Figure 11). There are a number of reasons for this, including extreme periods—like the financial crisis or the pandemic outbreak in early 2020—in which a shock to aggregate demand affects many assets in the same way, as well as the gradual financialisation of commodities in recent years, which makes it easier for more investors to trade them like stocks. Even the recently elevated correlation between commodities and equities is reasonably low, making commodities a very sensible addition to most investors’ portfolios, but investors shouldn’t overestimate their value as a hedge, especially during crisis periods, in which the diversification matters most.
We began discussing equity performance at the end of 2021 by referencing two macro stories playing out. First, it was clear by the end of last year that the Fed is well behind the curve in tackling inflation and will likely raise rates rather aggressively in coming months to catch up. Second, Omicron presents an additional challenge, promoting the very supply chain disruptions and labor shortages that have contributed to rising prices, and threatening growth in a way that makes monetary tightening that much more problematic. At the same time, US corporate profits remain strong and the first rise in rates need not correspond with a downturn in equities. Tenuous environments like this make many investors prone to mis-reaction, as greed gives way to fear, creating good conditions for stock picking.
Along these lines, a recent paper in the Journal of Financial Economics suggests one promising angle. Enough time has passed since the novel coronavirus emerged for academics to have had time to collect data (more likely their grad student research assistants did that) and digest the implications of the pandemic for stock returns. In an investigation of “corporate immunity to the COVID-19 pandemic,” Ding, Levine, Lin, and Xie (2021) study the characteristics that led some stocks to outperform in the initial shock of the COVID crisis. Among the features of winning stocks, not surprisingly, were financial slack, less stretched balance sheets, and stronger profitability: in a word, ‘quality’ stocks. We note that such companies are also among those most likely to rally if rising rates prompt sustained rotation from growth shares to value companies with strong fundamentals. And, of course, it’s a strategy of which Warren Buffett would likely approve.
Subscribe to receive the latest Rayliant research, product updates, media and events.
Subscribe
Sign upIssued by Rayliant Investment Research d/b/a Rayliant Asset Management (“Rayliant”). Unless stated otherwise, all names, trademarks and logos used in this material are the intellectual property of Rayliant.
This document is for information purposes only. It is not a recommendation to buy or sell any financial instrument and should not be construed as an investment advice. Any securities, sectors or countries mentioned herein are for illustration purposes only. Investments involves risk. The value of your investments may fall as well as rise and you may not get back your initial investment. Performance data quoted represents past performance and is not indicative of future results. While reasonable care has been taken to ensure the accuracy of the information, Rayliant does not give any warranty or representation, expressed or implied, and expressly disclaims liability for any errors and omissions. Information and opinions may be subject to change without notice. Rayliant accepts no liability for any loss, indirect or consequential damages, arising from the use of or reliance on this document.
Hypothetical, back-tested performance results have many inherent limitations. Unlike the results shown in an actual performance record, hypothetical results do not represent actual trading. Also, because these trades have not actually been executed, these results may have under- or over- compensated for the impact, if any, of certain market factors, such as lack of liquidity. Simulated or hypothetical results in general are also subject to the fact that they are designed with the benefit of hindsight. No representation is being made that any account will or is likely to achieve profits or losses similar to those shown. In fact, there are frequently sharp differences between hypothetical performance results and the actual results subsequently achieved by any investment manager.
You are now leaving Rayliant.com
The following link may contain information concerning investments, products or other information.
PROCEED