We often take it for granted that China’s market, dominated by non-professional investors, offers a large source of alpha to savvy traders. But who, if anyone, is actually able to unlock and profit from mispricings among Chinese stocks, and how do they do it? For most of the last two decades, the portfolios of foreign professional investors in China’s mainland stock market have been tracked and recorded. Studying the history of these trades, we identify the “smart money” in China’s market and pinpoint some strategies for replicating this success.
What can foreign investors’ trading activity tell us about the alpha available in emerging markets and the potential key to unlocking it? China presents an interesting laboratory for answering such questions. That’s because for most of the last three decades, foreign institutions seeking to invest in Chinese companies have found rather limited options, and when they have been allowed to access onshore-listed A shares, their holdings have been carefully tracked.
That offers us a window into the minds of professional investors trading Chinese stocks. We can use that insight to better understand who’s able to trade profitably in A shares, where their performance comes from, and how it might inform our own investment decisions. We’ll start by providing some background on the history of offshore investors’ experience trading A shares.
At the inception of China’s mainland exchanges, A shares were strictly off-limits to foreign investors, forcing them to make recourse to special share classes, such as B shares created expressly for offshore traders, H shares listed in Hong Kong, or ADRs listed in New York. Unfortunately, those alternatives weren’t always liquid, nor did they provide pure, broad exposure to the Chinese economy.
In 2002, the advent of China’s Qualified Foreign Institutional Investor (QFII) program—pronounced “kew fee”—allowed large institutions to secure a quota for onshore trading, but a cumbersome qualifying process, fluctuating quotas (only eliminated relatively recently, in September 2019), as well as restrictions on repatriation of invested capital left something to be desired. Finally, beginning in late 2014, the Stock Connect platform offered foreign investors relatively easy access to A shares, creating a bridge between the Hong Kong Stock Exchange and China’s two mainland exchanges in Shanghai and Shenzhen. Fortunately for researchers, the QFII and Stock Connect programs have together generated over a decade of data on foreign investor portfolios. Below we’ll put that to interesting use.
We usually take it for granted that professionals will have more skill analyzing companies and trading shares than amateurs. We expect that institutional investors will best retail traders when it comes to unearthing truly novel information about stocks’ future trajectories. In the case of A shares, a vast majority of onshore trading is done by retail investors, creating mispricings that professionals might exploit. That’s one of the major reasons foreign institutional investors have tried so hard to access mainland China markets in the first place. But is it true that institutions outperform in a market dominated by retail investors? Put another way: Who represents the “smart money” in China A shares? Below we look at three groups of investors.
QFII Traders
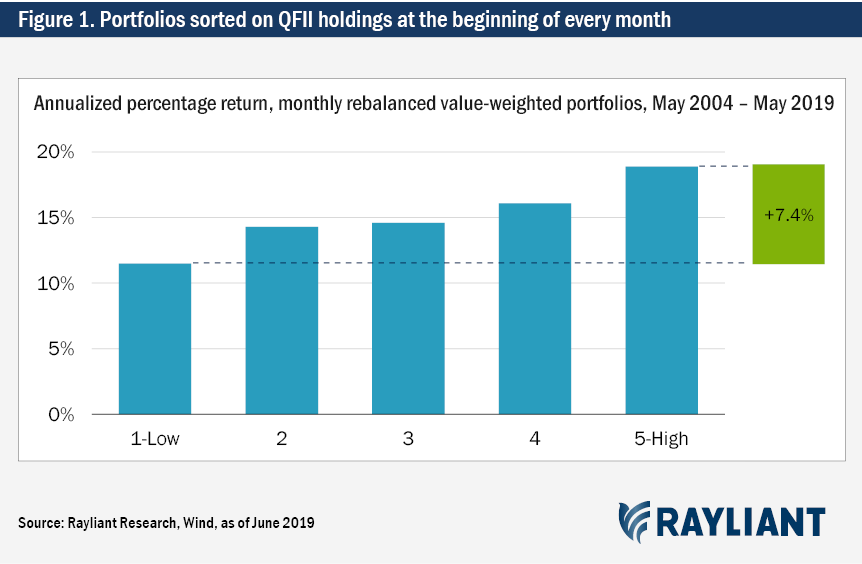
The first foreign institutional investors to make an impact trading A shares were those trading through a QFII quota, since that program was around long before Stock Connect launched. If we’d like to test whether QFII investors have special skill at stock picking in China, one approach is to compare the stocks most heavily bought by QFII investors with those least held in QFII portfolios. We have data on the percentage of each stock’s shares held by QFII traders going back to May 2004. In Figure 1, we rank stocks every month into five groups based on the percentage of each stock’s shares held by QFII investors, plotting the annualized average returns of these simulated portfolios.1

As expected, stocks with the highest QFII holdings outperform stocks with the lowest QFII holdings by a statistically significant 7.4% per annum. In other words, QFII traders have been historically successful at picking winners among China A shares, suggesting foreign institutions know something the market doesn’t when it comes to valuing Chinese stocks. What about investors using Stock Connect?
Northbound Connect Investors
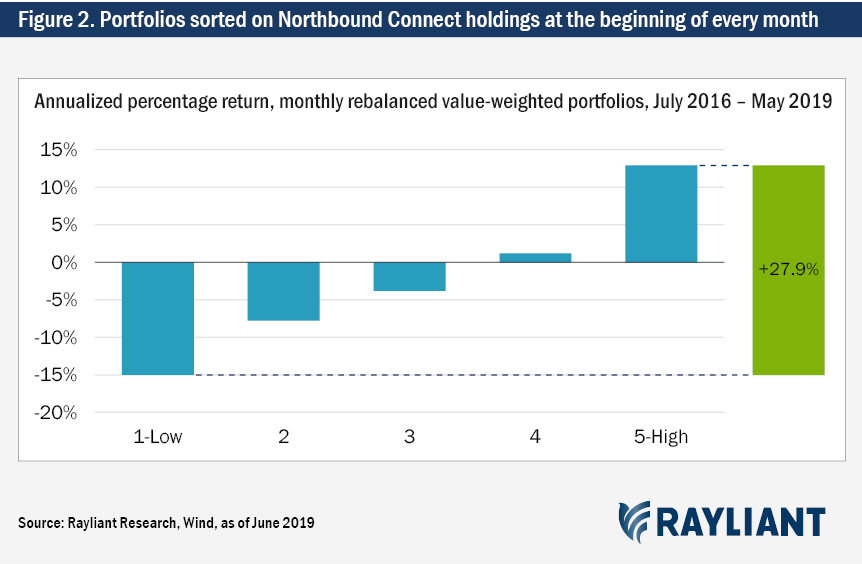
While Stock Connect opened for northbound trading in November 2014 (Shanghai) and December 2016 (Shenzhen), we only have data on Northbound Connect holdings beginning in July 2016. Once again, we’ll take the approach of comparing returns for portfolios sorted every month on the percentage of each stock’s shares held by Northbound Connect investors, as illustrated in Figure 2.

As with the QFII traders, we find that investors accessing A shares through the Stock Connect platform seem to have more information than the rest of the market, systematically loading up on stocks that subsequently outperform and avoiding stocks that turn out to be future losers. The time horizon is shorter, but the effect is much stronger. Stocks with the highest Northbound Connect holdings outperform those with the lowest Northbound Connect holdings by a whopping 27.9% per year. That’s solid evidence of the attractive alpha opportunity for professional investors who manage to access mainland China’s retail-driven equity markets.
Southbound Connect Traders
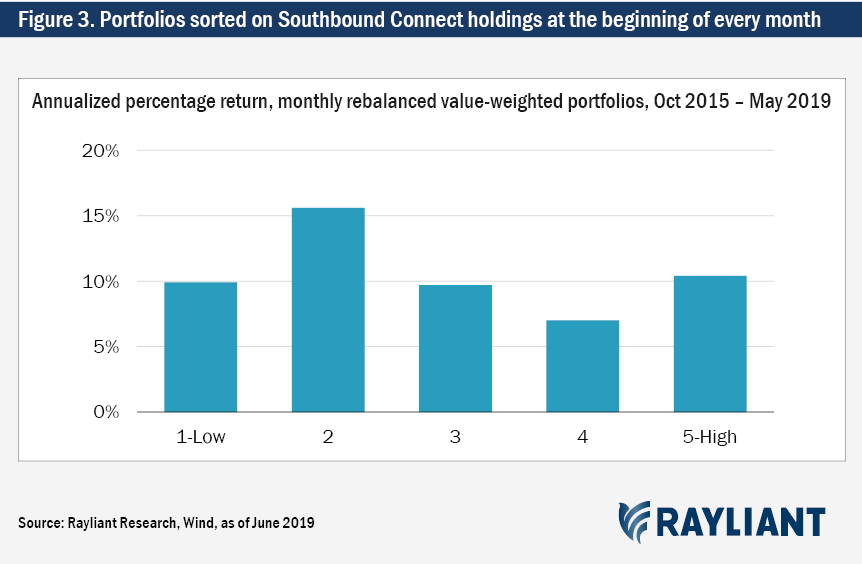
Before digging deeper into the drivers of foreign investor outperformance in trading China A shares, it’s worth taking a quick detour to consider what happens to Stock Connect traffic moving in the opposite direction. How do mainland investors fare when they trade southbound to access Hong Kong stocks? For Southbound Connect, our data extend back to October 2015. Figure 3 depicts returns for portfolios sorted every month according to the percentage of each stock’s shares held by Southbound Connect investors.

Before parsing the results, we should note that Southbound Connect traders aren’t necessarily retail investors. To qualify for use of Southbound Connect, an investor’s account balance must total no less than RMB 500,000 (around US$70,000). On the other hand, unlike onshore trading, which is mostly retail, Hong Kong’s stock exchange is crowded with professionals.
Indeed, the results in Figure 3 suggest that however sophisticated Southbound-eligible traders may be, they aren’t able to beat out heavy competition in the Hong Kong market; stocks most widely held by Southbound Connect investors earn effectively the same return as stocks eschewed by Southbound Connect traders. This “negative” result stands in stark contrast to the patterns observed earlier for mainland stocks, suggesting market inefficiency and an influx of foreign investors have created an altogether different dynamic for China A shares— one where mispricings persist and we can readily observe them by tracking the trades of offshore professionals.
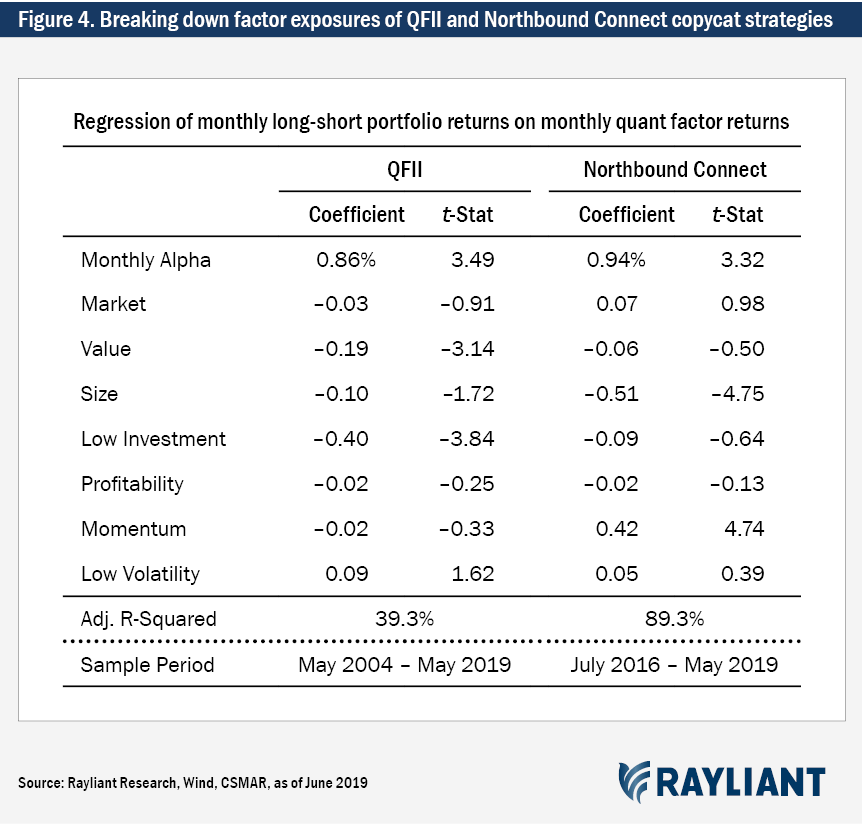
We’ve established that QFII and Northbound Connect traders seem to be “smart money” investors in A shares, soundly beating the market, buying future winners and selling future losers. But do they truly have more information than domestic investors? Based on the portfolio sorts in Figures 1 and 2, we’ve simulated “copycat” strategies, which long the stocks with highest foreign institutional ownership and short the stocks with lowest foreign institutional ownership. In the interest of better understanding offshore investors’ edge, see Figure 4 reports attribution of these portfolios against popular quant factors.

We see that QFII portfolios tend to pursue growth stocks with high asset growth and a weak tilt toward shares with lower volatility, while Northbound Connect investors follow a momentum strategy. Both sets of foreign investors tend toward large-cap names. And while exposure to standard quant factors explains almost 40% of the variation in QFII traders’ returns, and nearly 90% of the variation in Northbound Connect portfolio performance, these foreign institutional investors earn 0.86% and 0.94% per month, respectively, from non-factor sources. They’re clearly going beyond smart beta and bringing new information to bear in their quest for alpha among the A shares.
For offshore investors contemplating an allocation to China A shares—or other emerging markets, for that matter—it will be reassuring to learn that foreign investors as a group outperform in a highly inefficient, retail-dominated stock market. Traditional quant factors provide one means of harvesting the alpha available in A shares, but QFII and Northbound Connect traders demonstrate the ability of foreign investors to uncover more nuanced sources of information not yet baked into the price of Chinese stocks, earning a tidy profit in the process. Indeed, with data available on these investors’ holdings, even those building proprietary models for trading A shares will do well to consider how each stock stacks up in the observed portfolios of foreign traders.
1 Within each of the five portfolios depicted, we weight stocks by their free-float-adjusted market capitalization to ensure the QFII copycat strategy’s performance isn’t dependent on the returns of exceedingly small companies’ stocks. Later, we’ll take the same approach when testing Northbound Connect and Southbound Connect holdings.
Subscribe to receive the latest Rayliant research, product updates, media and events.
Subscribe
Sign upIssued by Rayliant Investment Research d/b/a Rayliant Asset Management (“Rayliant”). Unless stated otherwise, all names, trademarks and logos used in this material are the intellectual property of Rayliant.
This document is for information purposes only. It is not a recommendation to buy or sell any financial instrument and should not be construed as an investment advice. Any securities, sectors or countries mentioned herein are for illustration purposes only. Investments involves risk. The value of your investments may fall as well as rise and you may not get back your initial investment. Performance data quoted represents past performance and is not indicative of future results. While reasonable care has been taken to ensure the accuracy of the information, Rayliant does not give any warranty or representation, expressed or implied, and expressly disclaims liability for any errors and omissions. Information and opinions may be subject to change without notice. Rayliant accepts no liability for any loss, indirect or consequential damages, arising from the use of or reliance on this document.
Hypothetical, back-tested performance results have many inherent limitations. Unlike the results shown in an actual performance record, hypothetical results do not represent actual trading. Also, because these trades have not actually been executed, these results may have under- or over- compensated for the impact, if any, of certain market factors, such as lack of liquidity. Simulated or hypothetical results in general are also subject to the fact that they are designed with the benefit of hindsight. No representation is being made that any account will or is likely to achieve profits or losses similar to those shown. In fact, there are frequently sharp differences between hypothetical performance results and the actual results subsequently achieved by any investment manager.
You are now leaving Rayliant.com
The following link may contain information concerning investments, products or other information.
PROCEED