This research note covers topics treated at greater length in Hsu, Jason, Xiang Liu, and Phillip Wool, “Should You Have More China in Your Portfolio? Putting Common Arguments for Increased China Exposure to the Test,” Journal of Index Investing (2020). Despite China’s massive economic footprint, its rapid growth, and policy changes that make it easier for foreign investors to access mainland-listed stocks, Chinese equities still account for a small part of global benchmarks and consequently command little weight in the portfolios of most global asset owners. Investors considering a greater allocation to China will find no shortage of arguments supporting increased weight to onshore and offshore Chinese stocks, nor a lack of skeptical voices seeking to justify China’s implicit underweight in global benchmarks. Through a careful, evidence-based investigation of claims for and against a greater allocation to China, we provide investors with crucial data to make an informed decision about the role Chinese stocks might play in a global portfolio.
At the beginning of 2020, with 18% of the world’s population, the second-largest economy on the planet, an onshore stock market worth $8.5 trillion, and a claim to nearly 30% of global growth, China seemed poised at the start of a new decade to take a central role in the minds and portfolios of global investors.1 Why, then, do so many asset owners allocate so little weight to Chinese stocks?
One of the greatest contributors to this disconnect turns out to be inclusion levels of Chinese stocks set by providers of popular equity benchmarks. At present, notwithstanding its massive size along just about any financial dimension and despite its rapid economic growth, China’s onshore and offshore equities represent weights of roughly 0.4% and 4%, respectively, in global benchmark portfolios. These small allocations are largely a result of complex index inclusion rules focused on access, regulation, governance, and liquidity considerations. Unfortunately, index providers don’t specifically consider the investment thesis for including Chinese stocks in global benchmarks.
Considering the investment thesis for Chinese stocks, on the other hand, is exactly how a forward-thinking investor would rationally decide whether to get ahead of benchmark providers and allocate more to an asset class that seems destined for a bigger future position in global portfolios. To aid those making such decisions, in this research note we’ll critically examine six of the most common investment arguments in favor of a greater allocation to China onshore and offshore equities, as well as skeptical counterarguments to these claims, settling these debates once and for all by looking at the data and putting popular ideas about Chinese stocks to the test.
Many aspects of China’s financial future are up for debate, but there’s one fact on which everyone seems to agree: China’s economy is big and getting bigger. While China is still second to the U.S. in terms of GDP, that ranking is set to change. Indeed, forecasters widely project China to overtake the U.S. as the world’s largest economy by GDP before this decade is out. By other measures, like the Economist’s “Big Mac Index”, which adjusts the economic value of a country’s output according to the price its citizens pay for a McDonald’s cheeseburger, China’s move to the number one spot has already taken place (the IMF’s slightly more sober purchasing power parity calculations give rise to the same conclusion).
But how does a country’s economic size translate to its share in the portfolios of global investors? As Figure 1 shows, at least in the cases of China and the U.S., the correspondence is weak. At the end of 2019, while China made up 19% of global GDP, it only accounted for 4% of the MSCI All Country World Index (ACWI), a standard proxy for global investors’ equity holdings, while the U.S. made up 27% of world GDP and had a 54% weight in the MSCI ACWI portfolio. According to its current economic size, China is clearly underrepresented in investors’ portfolios.
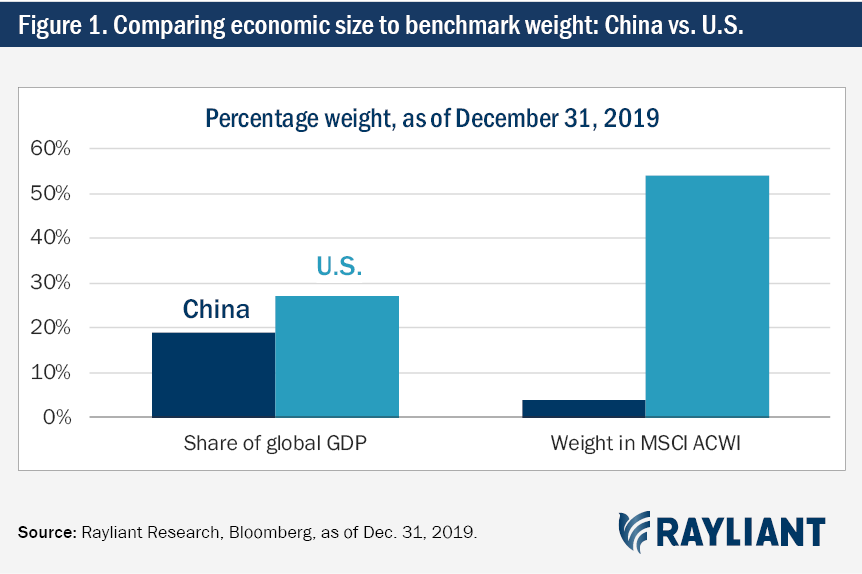
The next logical question on investors’ minds is whether they should hold countries’ stocks in proportion to the size of those nations’ economies? The evidence on that question turns out to be mixed. Proponents of so-called “GDP weighting” of equity portfolios—including the Oracle of Omaha, whose Buffett Indicator, calculated as the ratio of U.S. stock market capitalization to GDP, is widely tracked by market timers—point out the approach allocates more capital to countries that trade at cheaper valuations. In simulations over the last 15 years, GDP weighting does produce slightly higher returns than simple market cap weighting. Unfortunately, the benefits of this approach seem to diminish after adjusting for risk. Overall, we conclude that while Chinese stocks occupy a smaller place in global portfolios than the nation’s GDP share suggests they should, economic size alone doesn’t justify a bigger allocation to A shares.
KEY TAKEAWAY
China is expected to overtake the U.S. as the world’s largest economy by total GDP within the next decade, although the historical relationship between a country’s GDP and its future stock performance is weak. Economic size is likely not reason enough to add more exposure to China.
Related to claims about the benefit of buying markets with greater economic size is the argument that investors should seek exposure to economies growing at a faster rate. China is no stranger to growth, having clocked double-digit annual percentage gains in GDP from 1990 to 2010. Although the pace of China’s ascent has slowed a bit in recent years, its GDP is still climbing at roughly 6% per annum, easily beating OECD countries, which are averaging closer to 2% annual growth. With its young, well-educated, and highly skilled labor force fueling the rise of a middle class that promises to push the nation’s economy from one that is heavily reliant on cheap exports to one increasingly driven by tech innovation, China is among the few remaining large markets enjoying rapid economic expansion. Long-term investors who view their ultimate goal as “buying growth” will be tempted to increase their allocations to China on this basis. But do the data support that approach?
Looking at past academic research on the link between growth and stock returns, there is some cause for concern. Widely cited studies of developed and emerging markets find the relationship between GDP growth and stock returns to be weak, at best.2 Why wouldn’t growth translate to profits for investors? Although a number of candidate explanations have been proposed—the benefits of growth may flow to private companies more often than listed firms, for example, or it might be that a country’s growth is financed disproportionately by debtholders who reap most of the benefits—no single satisfying answer has emerged. Regardless of which theory prevails, the message to investors is clear: For growth to produce better stock returns, it must show up not just in a country’s GDP figures, but also in the profits of its publicly traded companies. Along these lines, in Figure 2 we report GDP growth, listed company EPS growth, and stock market returns for China and other economies, from 2005 through 2018.
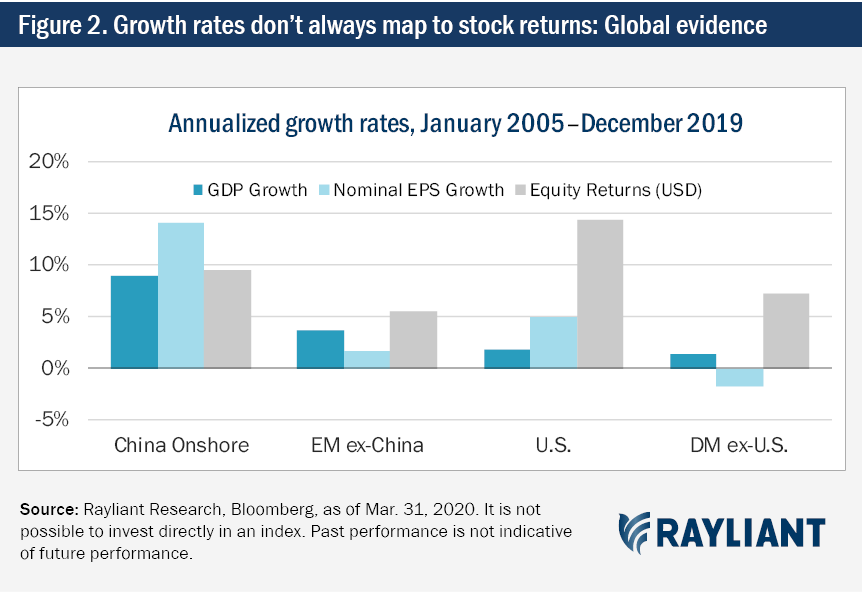
It’s clear from the data that the U.S. and China are outliers in this analysis. For both countries, not only has economic growth been robust, but publicly traded companies have meaningfully participated in those gains. By contrast, we find EPS growth for public companies in the Developed ex-U.S. and Emerging ex-China regions lagging growth in the broader economy. While it’s still a puzzle as to why GDP growth correlates with corporate EPS growth for some economies and not others, the data for China show a clear pattern of high GDP growth translating to high growth in corporate EPS, which ultimately leads to higher equity market returns.
Finally, it’s worth noting that the 14.6% annualized growth in corporate earnings shown for Chinese firms in the chart above is the growth rate for onshore listed companies. Offshore Chinese stocks—a group whose membership is heavily skewed toward large state-owned companies and mature, mega-cap non-state-owned firms—saw EPS grow at a lower rate of 6.5% per annum over the same period. The difference between onshore and offshore beta is something we’ll turn to again when we consider the correlation benefits of owning Chinese stocks. For now we simply conclude that Chinese stocks offer an opportunity to invest in the type of growth that matters to equity investors, and that it’s really the mainland-listed A shares, underrepresented in the portfolios of most global asset owners, that seem to provide the best access to that growth.
KEY TAKEAWAY
Onshore China has been an outlier among emerging markets, with rapid GDP growth mapping to greater EPS growth and better stock market performance. Offshore China turns out to be a poor substitute, with meaningfully lower EPS growth and stock market returns than China A.
Investors overweight China often predict a surge in A shares valuations as further index inclusions by major benchmark providers bring mainland stocks closer to full capitalization weights, spurring inflows to onshore Chinese stocks. To get a sense for the magnitude of that shift, it’s useful to remember that from its inception at the very end of 1992 all the way up to May 2018, the MSCI China Index didn’t actually hold any A shares. Since then, MSCI has added A shares to the index, but while the inclusion factor for offshore China has long been at 100%, the factor for China A shares still sits at a modest 20%, leaving substantial room for growth.
An upshot of this lag in A shares conclusion is that although China’s overall market capitalization at the end of 2019 was just under half that of the U.S., at around $17 trillion, Chinese stocks had only 4.5% weight in the MSCI ACWI global index, versus a weight of 55% for U.S. shares. The obvious conclusion is that it’s not just the size of China’s economy that doesn’t fit with its weight in popular benchmarks. Even by equity market capitalization, it seems A shares are woefully underrepresented in global stock indices.
So, what kind of inflows might we expect as China’s weight in benchmarks increases to full capitalization, prompting passive index money and active benchmark-aware assets to up their A shares allocations?
Figure 3 details a back-of-the-envelope estimate that nearly $320 billion of new inflows will hit A shares as MSCI moves to full inclusion of mainland Chinese stocks, considering only those assets benchmarked to MSCI’s ACWI and EM indices. As such, this is just the tip of the iceberg, with roughly $5 trillion in assets, all told, tracks various EM indices from providers like MSCI, FTSE, and S&P Dow Jones. Based on the broader set of EM benchmarks offered by these providers, a projected 13% increase in China A weight would result in roughly $650 billion of new assets flowing into onshore stocks. Given A shares’ current $8.5 trillion valuation, this shift could have a meaningful impact on the market.
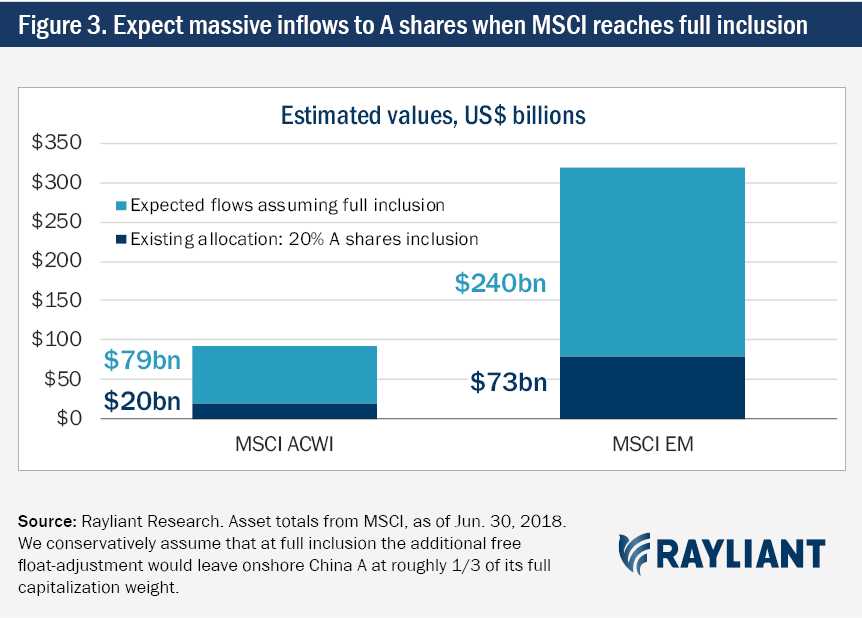
Looking back anecdotally on previous MSCI EM Index inclusion events—including those of South Korea, India, South Africa, Taiwan, Russia, and Offshore China—one finds stock valuations do tend to rise in the years subsequent to being added to the benchmark. That said, while a short-run bump in A shares prices might very well result from a temporary imbalance between supply and demand in the immediate wake of future increases to benchmark inclusion factors, evidence on higher long-run equity returns subsequent to index inclusion turns out to be mixed (although offshore Chinese stocks annualized 23.5% in the decade following their June 2000 addition to MSCI EM).
In the end, greater benchmark inclusion and a sustained influx of foreign professional investors into China’s equity market could be most valuable to investors as a strong indication that index providers and foreign institutional investors remain happy with China’s progress on issues ranging from regulatory policy and legal protections to market access and reporting standards. In this sense, stronger transparency and governance could ultimately have a greater impact on long-run valuation multiples than flows themselves.
KEY TAKEAWAY
Further increases in benchmark weight toward full inclusion will be a near-term tailwind for A shares in coming years, producing hundreds of billions of USD in flows. Evidence of a longer-term jump in valuations and returns after inclusions is mixed, although further inclusion will signal better conditions for foreign investment.
While we have so far focused our attention on returns, another common argument in favor of a bigger allocation to Chinese stocks relates to risk. Proponents of greater exposure to Chinese equities often mention China’s low correlation with other major equity markets, leading to risk reduction for global investors diversifying into Chinese stocks. The evidence lines up with this claim, as illustrated in Figure 4, which plots correlations between U.S. stocks and other developed markets stocks, emerging markets equities excluding China, and onshore and offshore Chinese shares. We calculate correlations over our full sample, from January 2005 through March 2020 (blue bars), as well as during periods of market stress during the last 15 years, including the Global Financial Crisis, the European Debt Crisis, and the COVID-19 pandemic (light blue bars).
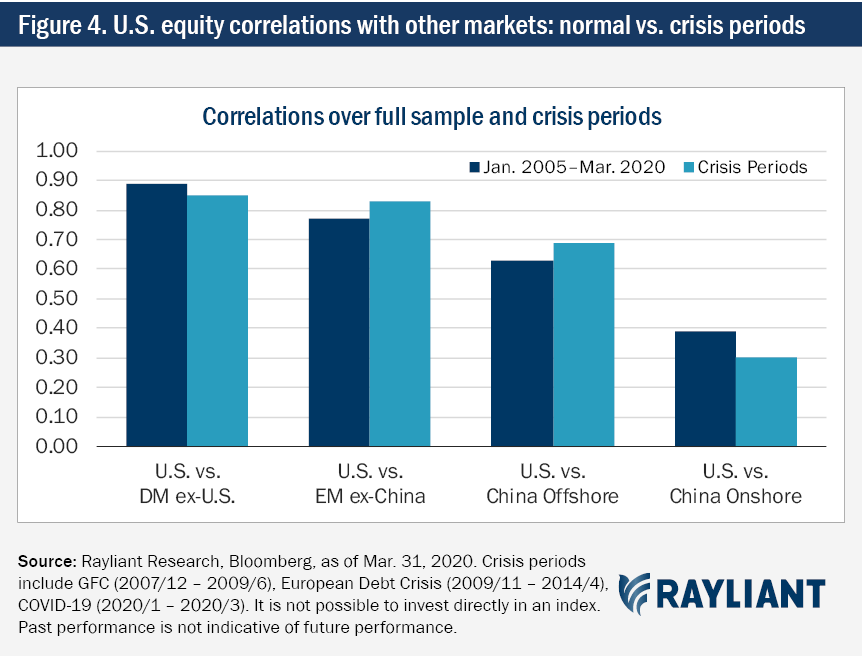
The full-sample correlation between U.S. equities and other DM stocks is quite high at 0.89, while EM ex-China and offshore Chinese stocks provide some diversification benefits, with correlations to U.S. shares of 0.77 and 0.63, respectively. With a surprisingly low full-sample correlation of just 0.39, China A shares stand in a league of their own with respect to the diversification opportunity they offer to global investors. Keeping in mind the adage that “the only thing that rises in a falling market is correlation”—referring to the loss of diversification during a crisis, precisely when investors need it the most—a bigger surprise is what happens to correlations in periods of market stress. We see that although U.S. stocks’ correlation to EM ex-China and offshore China climbs in crisis periods, the correlation between onshore Chinese stocks and U.S. shares actually declines significantly, reaching 0.30 in times of market turmoil.
To understand the markedly lower correlations observed for China A shares—both in normal times and during crisis periods—it helps to consider two key differences between mainland stocks and their global counterparts. First, as we noted when considering GDP growth as an argument for increased China exposure, the transformational growth of companies listed on China’s mainland exchanges is distinct from that experienced in other markets, including the growth of offshore-listed Chinese firms. The second important distinction, which will be even more relevant when we consider the alpha available in China A, is that onshore investors consist primarily of non-professional retail traders, who react to news in an idiosyncratic way, while global stocks, including offshore Chinese stocks listed in Hong Kong and elsewhere, are mostly traded by sophisticated institutional investors. Taken together, these features lead to a return profile for A shares that differs substantially from that of other global stocks.
KEY TAKEAWAY
Onshore Chinese stocks have remarkably low correlation with global equities, and correlation actually decreases significantly during crisis periods, leading to strong diversification benefits from adding China to a global portfolio. EM outside of China—and even offshore Chinese stocks—don’t offer the same level of risk reduction as China A shares.
Continuing on the topic of risk among Chinese stocks, it’s also important to address the high level of historical volatility experienced by A shares investors—amounting to nearly 30% annualized over the last fifteen years—and what that means for those adding China A to a global portfolio. Indeed, skeptics of the China diversification story point out that the correlation benefits could be moot if A shares’ volatility is too high to begin with. Of course, what matters is not a stock’s return or its risk, but the return investors earn per unit of risk they bear. To get a better picture of risk-adjusted performance, Figure 5 charts returns and risk for U.S. shares, Developed ex-U.S. and Emerging ex-China equities, as well as onshore and offshore Chinese stocks.
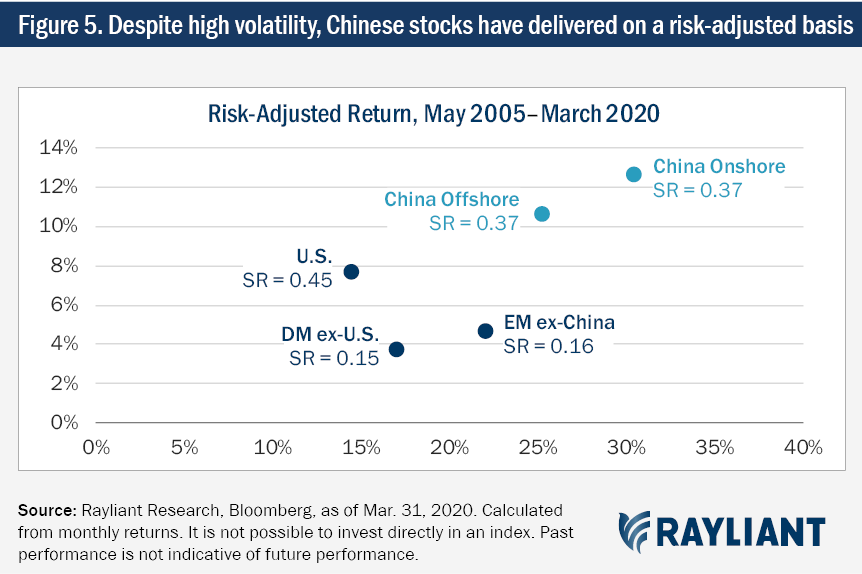
In markets outside the U.S. and China, we observe the classic low-volatility puzzle, with DM ex-U.S. stocks posting just 3.8% returns on volatility of 17.0% per annum (SR = 0.15) and EM ex-China shares annualizing 4.7% returns on 22.0% volatility (SR = 0.16). The case of EM stocks, in particular, has been a source of frustration for many investors, given the popular view that emerging markets are a way to accept more risk in exchange for amplified returns. Meanwhile, stocks in the U.S., one of the most developed stock markets, have returned 7.8% per year with only 14.4% volatility (SR = 0.45), offering a comparatively attractive risk-reward tradeoff. While Chinese stocks are significantly more volatile—with A shares registering over twice as much volatility as U.S. equities over our sample—they also provide commensurately higher returns. Onshore and offshore Chinese stocks returned 12.6% and 10.6%, respectively, on volatility of 30.4% and 25.3%, annualized (SR = 0.37 for both regions), dispelling fears that high volatility is a problem for Chinese stocks and offering investors better performance using China to access EM than they would have experienced using EM to access China.
KEY TAKEAWAY
Despite exhibiting much higher volatility, Chinese stocks offer investors a compelling risk premium, with a Sharpe ratio comparable to that of U.S. equities and significantly higher than that earned by other emerging and developed markets.
Each of the preceding arguments for a greater allocation to Chinese stocks are perfectly applicable to passive strategies, each addressing some aspect of the beta associated with increasing one’s weight to China. For global asset owners searching for outperformance, another widely claimed feature of China’s market that could make it particularly attractive is the relatively large alpha opportunity it offers. Many investors are familiar with mounting evidence in the academic literature pointing to a diminished ability of active managers to eke out alpha in developed markets; in stark contrast, recent research has shown strong empirical support for the ability of money managers in China to achieve market-beating returns.3
What explains the difference in available alpha across developed and emerging markets? One promising theory is that China’s market, where 80-90% of trades are made by non-professional individual investors, is simply less efficient than developed markets, where retail trading accounts for something on the order of 2% of overall volume. Investing for alpha is a zero-sum game, and we should clearly expect better-informed and highly experienced equity managers will have a meaningful edge trading stocks in a market like China’s. In Figure 6, we put this hypothesis to the test, ranking a set of developed and emerging markets by estimates of retail investor participation (Panel A), then plotting the average returns in each market from simple quant strategies—including popular factors, ranging from Value and Quality to Low Risk and Momentum—over the last 5 years (Panel B).
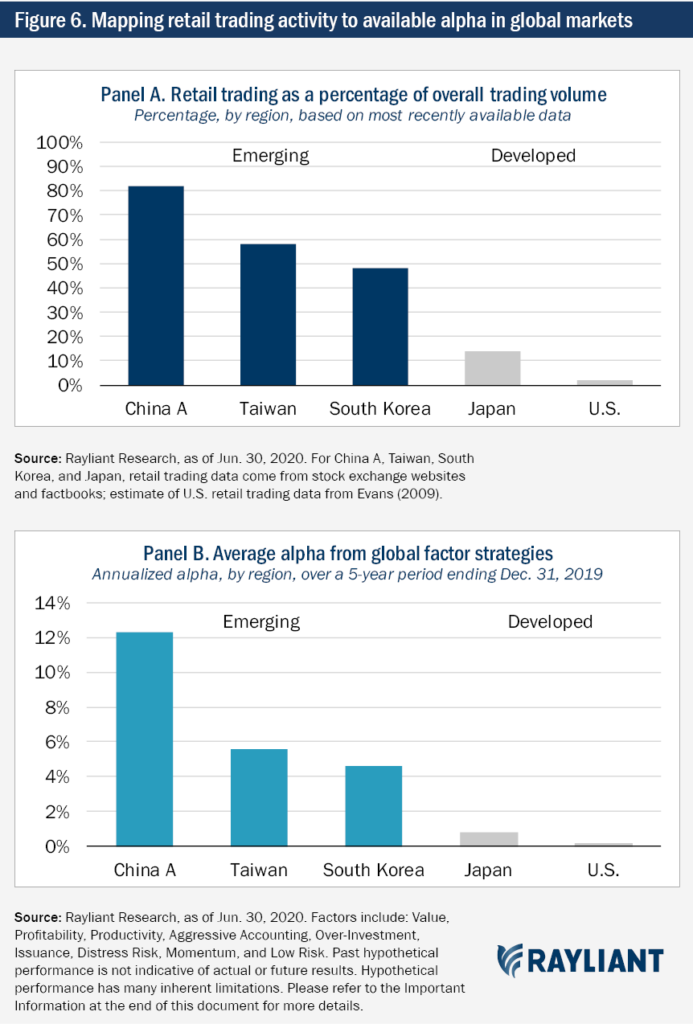
As the plots above illustrate, while simple factor strategies barely delivered positive returns in recent years in the U.S. and Japan—markets crowded with professional investors—the same strategies produced superior returns in emerging markets, like China, Taiwan, and South Korea, where retail traders’ behavioral mistakes created opportunities for those taking a systematic, data-driven approach to investing. Indeed, the ranking of retail participation is identical to the ranking of markets in terms of available alpha, strongly supporting the case for targeting active strategies toward less efficient markets. And while we opted to show performance of straightforward factor strategies in this section to make a point about the general relationship between retail investor participation, market inefficiency, and expected alpha, we expect more sophisticated active strategies to have an even greater edge in China.
KEY TAKEAWAY
Across EM and DM, simple factors earn higher alpha in markets with greater retail trading, confirming the link between market inefficiency and alpha available to active investors. As such, China A shares, with amateur trades accounting for 80-90% of volume, present a compelling opportunity for investors seeking outperformance through systematic strategies based on investor behavior.
In the charts and analysis above, we’ve considered six standard arguments in favor of greater allocation to China. Our goal throughout has been to present an objective, evidence-based assessment of each claim in an attempt to settle these debates once and for all on behalf of global investors considering an increased portfolio weight to Chinese stocks. While some common justifications for investing in Chinese stocks fare better than others in the face of hard data and rigorous testing, we ultimately find strong support for a greater push into mainland Chinese A shares, which offer unique benefits in terms of both the beta and alpha available to active investors in China’s onshore equity markets.
1 Data from the United Nations, the World Federation of Exchanges, and the International Monetary Fund
2 In one of the most comprehensive early studies on the topic, Ritter (2005) investigates 16 developed markets from 1900, and finds no significant correlation between growth and stock returns; Ritter (2012) and Dimson, Marsh, and Staunton (2014) provide an update of that research and extend the finding to emerging markets.
3 Fama and French (2010) is one of many studies highlighting the difficulty active managers have earning alpha in developed markets, while Cornell, Hsu, Kiefer, and Wool (2020) document meaningful skill among domestic mutual fund managers trading China A shares.
Cornell, Bradford, Jason Hsu, Patrick Kiefer, and Phillip Wool. “Assessing Mutual Fund Performance in China.” The Journal of Portfolio Management 46, no. 5 (2020): pp. 118–127.
Evans, Alicia Davis. “A Requiem for the Retail Investor?.” Virginia Law Review (2009): pp. 1105–1129.
Dimson, Elroy, Paul Marsh, Mike Staunton, and Jonathan Wilmot. “Credit Suisse Global Investment Returns Yearbook 2014.” Zurich: Credit Suisse Research Institute (2014).
Fama, Eugene F., and Kenneth R. French. “Luck versus skill in the cross‐section of mutual fund returns.” The Journal of Finance 65, no. 5 (2010): pp. 1915–1947.
Ritter, Jay R. “Economic growth and equity returns.” Pacific-Basin Finance Journal 13, no. 5 (2005): pp. 489–503.
Ritter, Jay R. “Is Economic Growth Good for Investors? 1.” Journal of Applied Corporate Finance 24, no. 3 (2012): pp. 8–18.
Subscribe to receive the latest Rayliant research, product updates, media and events.
Subscribe
Sign upIssued by Rayliant Investment Research d/b/a Rayliant Asset Management (“Rayliant”). Unless stated otherwise, all names, trademarks and logos used in this material are the intellectual property of Rayliant.
This document is for information purposes only. It is not a recommendation to buy or sell any financial instrument and should not be construed as an investment advice. Any securities, sectors or countries mentioned herein are for illustration purposes only. Investments involves risk. The value of your investments may fall as well as rise and you may not get back your initial investment. Performance data quoted represents past performance and is not indicative of future results. While reasonable care has been taken to ensure the accuracy of the information, Rayliant does not give any warranty or representation, expressed or implied, and expressly disclaims liability for any errors and omissions. Information and opinions may be subject to change without notice. Rayliant accepts no liability for any loss, indirect or consequential damages, arising from the use of or reliance on this document.
Hypothetical, back-tested performance results have many inherent limitations. Unlike the results shown in an actual performance record, hypothetical results do not represent actual trading. Also, because these trades have not actually been executed, these results may have under- or over- compensated for the impact, if any, of certain market factors, such as lack of liquidity. Simulated or hypothetical results in general are also subject to the fact that they are designed with the benefit of hindsight. No representation is being made that any account will or is likely to achieve profits or losses similar to those shown. In fact, there are frequently sharp differences between hypothetical performance results and the actual results subsequently achieved by any investment manager.
You are now leaving Rayliant.com
The following link may contain information concerning investments, products or other information.
PROCEED