
“Peace is not the absence of conflict, but the ability to cope with conflict by peaceful means.”
—Ronald Reagan
Speaking with investors in January, one of the most common questions an advisor hears is “What kind of market should clients prepare to navigate in the new year?” Judging by widely reported news headlines and market action over the first few weeks of 2026, it’s a safe bet that “geopolitics” has featured in many an advisor’s outlook. In one short month—against the backdrop of a Russian assault on Ukraine entering its fourth year—we’ve witnessed a covert mission by US forces to capture Venezuela’s president, a state-imposed Internet blackout amidst explosive protests in Iran, not to mention an escalating push by the White House to mount a hostile annexation of Greenland. Feed all of that drama into a 24-hour news cycle, and it’s easy to imagine doomscrolling investors might have some concerns about the risk of global political instability spilling over into their portfolios.
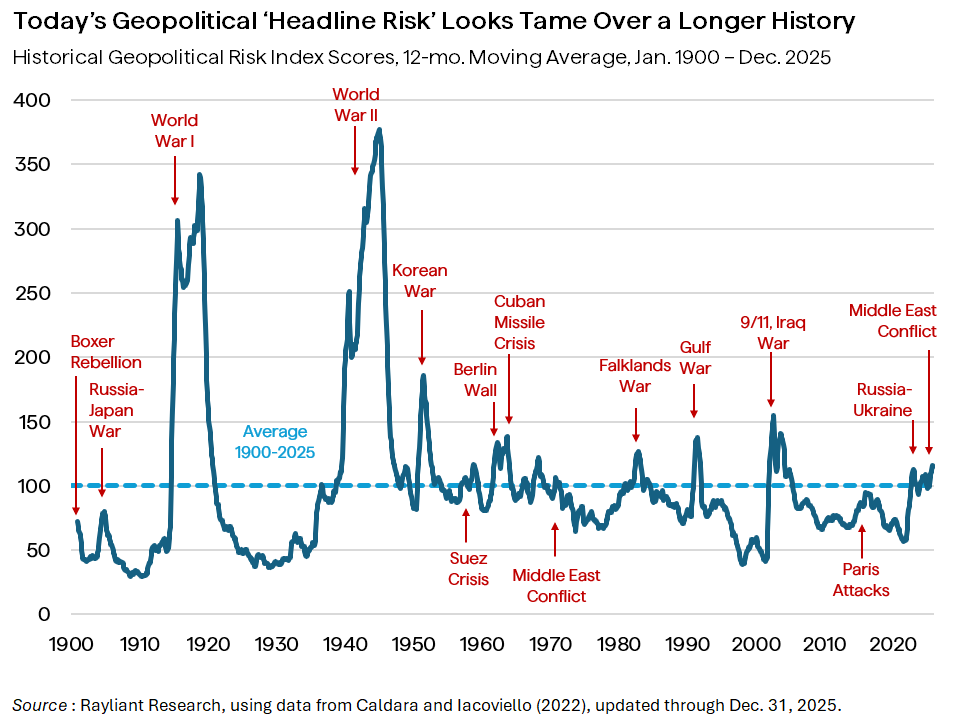
But how big is the risk, really? That might sound like a tough thing to gauge for a topic as broad and seemingly abstract as “geopolitics,” but in this Age of Big Data—as we’ve seen before—it’s often possible to find new tools for grappling with questions like this. When it comes to the economics of geopolitical tension, one of the best resources is a pair of economists at the Federal Reserve Board of Governors, Dario Caldara and Matteo Iacoviello, who’ve built an intriguing signal that measures the incidence of adverse geopolitical events based on newspaper text. One nice thing about their approach is that it’s capturing news sentiment: exactly what one imagines is driving investors’ fears around the impact on their portfolios. Another benefit of Caldara’s and Iacoviello’s measure is that it can be applied to data going back well over a hundred years, as we’ve plotted above.
Likely the first thing that comes across when we peek at the chart is that despite Russia–Ukraine, the past year’s Middle East conflict, and now the Trump Administration’s escapades with respect to Venezuela and Greenland all feeling very dramatic, none of this seems to come close to the magnitude of shocks like 9/11 and the Cuban Missile Crisis, let alone the extreme trauma associated with a pair of World Wars in the first half of the last century. While most of us will have strong memories of how stocks reacted at the onset of Russia’s attack on Ukraine and some of us will remember the financial stress in the wake of September 11th and the subsequent war in Iraq, very few of us were navigating portfolios amidst the truly existential ups and downs of the Cold War. In that sense, zooming out like this delivers a potentially comforting perspective: Namely, that we may just be living in a safer world than any of the generations of investors who came before us.
Even so, recognizing that there are indeed big ups and downs in the plot above, some investors will look at those gyrations and be tempted to consider them an invitation to time the market, seeking safety in cash when tensions are rising. Thinking more deeply about the history of geopolitical shocks and how they’ve impacted the US stock market, our prospective market timer might wish to reconsider. Based on data from the chart above, we performed a neat little exercise, identifying the 10 biggest one-month jumps in geopolitical risk since 1900: a set of months which includes events within both World Wars, the 9/11 attacks, the outbreak of the Korean War, the Gulf War, and the Cuban Missile Crisis. We then simulated a very simple strategy, going long the S&P 500 Index the month after each such jump and holding for the next five years. The average annualized rise in the market over those stretches was just under 7%. According to data compiled by Professor Robert Shiller at Yale University, that turns out to be meaningfully above the 5.7% annual price return associated with the U.S. equity market (using Shiller’s long-run S&P composite series) over the full period, from January 1900 to December 2025. The takeaway? Historically, a simple buy-and-hold approach—even amidst big geopolitical risk—has often proven difficult to outperform.
Disclosure: This material is for informational purposes only and should not be considered investment advice. An investor should consult with their financial professional before making any investment decisions. The opinions contained herein are subject to change without notice and do not necessarily reflect the opinions of Rayliant Investment Research. Indices cannot be invested in directly and are unmanaged.
Any performance discussion or analysis herein is hypothetical and for illustrative purposes only. Hypothetical or simulated performance results have inherent limitations and do not reflect actual trading, transaction costs, taxes, or market frictions. Past performance is not indicative of future results
You are now leaving Rayliant.com
The following link may contain information concerning investments, products or other information.
PROCEED


