Perspectives
Phillip Wool, Ph.D.
Scroll down
“Whipsaw movements in country tariff rates will do nothing to reduce already record levels of trade-policy uncertainty. Trump appears to consider uncertainty a positive for negotiations. For businesses and markets, it’s a drag.”
— Economists Rana Sajedi, Maeva Cousin, and Tom Orlik @ Bloomberg Economics
Like many investors over the last few weeks, we’ve fallen into a new morning routine: checking the US equity market futures to see whether it’s likely to be an “up 3%” or “down 3%” day. Such extreme volatility has seemed to be the only certainty for stock investors facing down a daily stream of updates and commentary on Trump 2.0 tariffs, the reactions of America’s trading partners around the world, and the impact all of this will have on the economy and markets.
Of course, it’s not unheard of for stocks to witness big daily gains and losses. Looking at the last 65 years of S&P 500 Index trading activity, spanning over 16,000 trading sessions from 1965 through the end of 2024, we find that the S&P 500 has experienced moves of at least 3% up or down on exactly 241 occasions. In other words, just about four “big days” per year. To put things into perspective, we’ve witnessed four such days—a whole year’s worth—in the span of just one calendar week following the Trump administration’s April 2nd “Liberation Day” announcement of broad US tariffs.
That kind of jarring uncertainty is also showing up in the VIX “fear index”, which tracks implied volatility in S&P 500 options, giving us a real-time gauge of equity investors’ anxiety. Over the last decade, the VIX showed average expected volatility for the S&P 500 of roughly 18%: a relatively tranquil state for a “risk asset” like common stocks. In the week following Liberation Day, driven in part by those big up and down days we just mentioned, the VIX surged to over 50% annualized volatility, before settling in at just over 30% in the last week.
So far, we’ve been thinking about uncertainty in the markets: investors trying to determine what a trade war might mean for corporate earnings and the price of companies’ shares. Behind those stocks, there’s a more fundamental type of uncertainty, with consumers and companies’ managers wondering where in the world tariffs will land when all is said and done. In fact, uncertainty over the fundamentals of trade is even more pronounced than volatility in the markets.
We can actually visualize the fear around Trump 2.0 tariffs quite easily, thanks to Professors Scott Baker, Nick Bloom, and Steven Davis, a group of economists at Northwestern and Stanford, who statistically analyze keywords in the text of over 2,000 US newspapers to chart different types of economic policy uncertainty. When we plot their measures of uncertainty specifically related to trade, we find that although Donald Trump’s first term was already record-breaking in terms of trade stress, the economic shock of the second term has been positively off the charts.
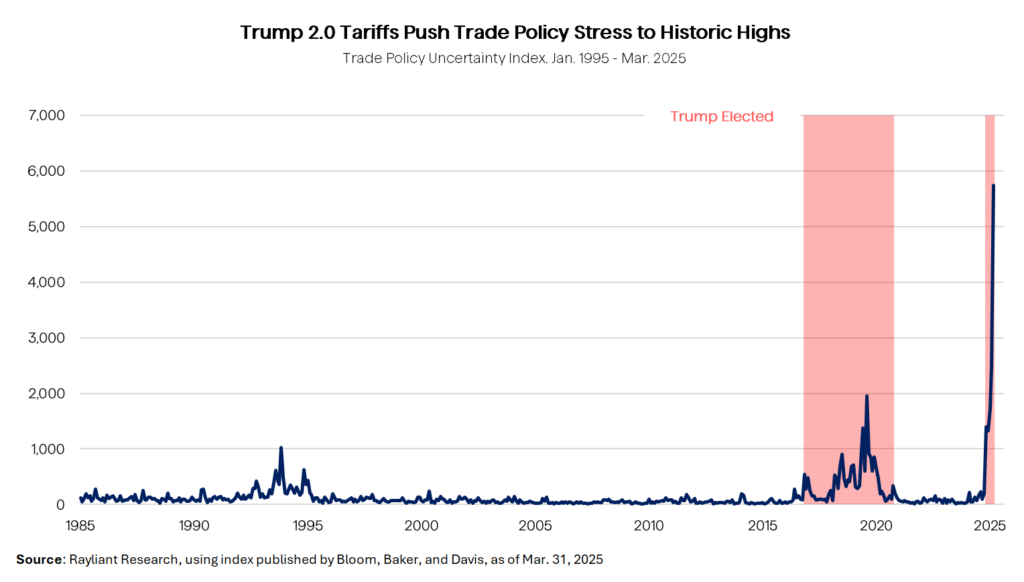
Looking at the chart above, with an eye-popping break from the norm—quite literally ripped from the headlines—it’s easy to see why investors have been collectively freaking out, herding out or piling in to stocks from one day to the next. On the other hand, it’s worth remembering that financial and economic uncertainty like that we’ve discussed and plotted above likely doesn’t last forever. Historically, it often hit unexpectedly, it tended to come in clusters, but it eventually resolved, often just as unexpectedly.
That can be a challenge for market timers, attempting to dip in and out at market bottoms and tops, but it’s good news for those who stay fully invested. When one zooms out, episodes of volatility like the one we’ve experienced in April 2025 are often barely discernable on a chart. Remember those statistics around the S&P 500 we referenced earlier? The total return to US stocks over that 65-year stretch—complete with 122 “down days” of at least 3%—comes out to around 10.4% per annum: a cumulative 64,000%. Not bad performance for an investor willing to buy-and-hold through those volatile patches that arise from time to time.
Disclosure: The reader should not assume that an investment in the indexes described above was or will be profitable. The opinions contained herein are subject to change without notice and should not be construed as investment advice. Past performance is not indicative of future results.
You are now leaving Rayliant.com
The following link may contain information concerning investments, products or other information.
PROCEED