
“The question that people pose—are we in a bubble?—seems to me a little bit vague.
We’re always in a bubble somewhere.”
—Robert J. Shiller, Nobel laureate economist, interviewed by CFA Institute in 2019
When the S&P 500 closed on September 30, 2025, its price was just a few dollars off of an all-time record high hit the prior week, with US stocks having bounced back a stunning 34% since making “Liberation Day” lows in early April. It was a different market milestone, however, that caught our attention at the end of Q3: September marked the second-highest level ever for a well-known valuation metric, the CAPE ratio, only exceeded at the height of the dot-com bubble, back in 1999 (see below). That could explain why Fed chair Jerome Powell, in a speech following last month’s FOMC, described equity prices as “fairly highly valued.” With that in mind, while many investors watching equities’ 2025 rally are probably feeling the FOMO, we prefer to explore what sky-high valuations might mean for the market’s future performance.
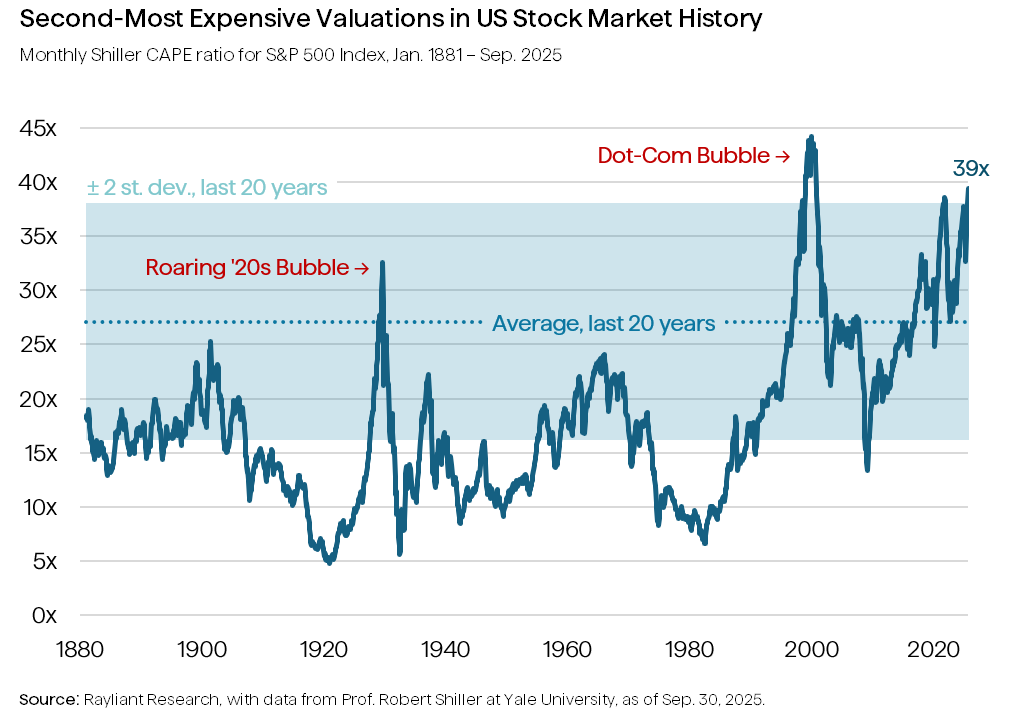
It’s worth taking a moment to explain what exactly the CAPE ratio is, and what it’s meant to capture. Popularized by Yale Professor Robert Shiller—and most famously promoted during the Internet stock craze of the late 1990s—the Cyclically Adjusted Price-to-Earnings ratio is actually similar to the P/E ratio most of us will have seen many times before. That measure divides the market’s price into the last 12 months’ EPS of companies making up the index, answering the question: How much does an investor have to pay for each dollar of last year’s earnings? When the price we pay for the same dollar of earnings is much higher today than it was before, we might say stocks are a little too pricey. When earnings can be bought on the cheap, perhaps it’s a bargain.
What the CAPE ratio does differently is to account for a simple intuition about earnings: the fact that companies’ profits vary over the course of the business cycle, peaking during macro booms and bottoming out amidst recessionary busts. Along those lines, rather than comparing price to last year’s earnings, the CAPE ratio compares the real price of the index to an average of the last 10 years’ inflation-adjusted earnings—essentially smoothing out the cyclical variation in EPS, leading to a more robust representation of where prices stand relative to the market’s history.
Once again, judging by the chart above, US shares are certainly on the expensive side. Recognizing that companies and markets have evolved quite a bit since the 1870s—yes, Professor Shiller has collected data covering well over a century in the stock market—we’ve plotted a band of plus-or-minus two standard deviations around the mean return over just the last 20 years, and the CAPE ratio is testing the top end of that range in recent months.
But what does all of this mean? We’ve been following broad market returns long enough to know that reliably predicting what’s going to happen over the next year, let alone in the next week or month, is far from a sure thing—and probably closer to an impossibility. On the other hand, we do believe today’s valuations might serve as a helpful indicator of longer-term stock market performance. Historically, again turning to Professor Shiller’s data on S&P 500 returns over the decades, when the CAPE has been in excess of 30x, stock returns over the next 10 years have been slightly negative to low single digits. As such, it wouldn’t surprise us in the least if US equities end up delivering lower-than-average performance as earnings gradually catch up to valuations.
In the meantime, we acknowledge there are plenty of things that could yet keep prices moving higher in the short run: the Fed is easing again, President Trump is pushing some pro-business policies, and it’s anybody’s guess when enthusiasm for AI might wane, to name a few. Rather than dump stocks and retreat to cash, investors might consider a number of less dramatic moves. Opting for active selection of stocks could help to avoid the most over-hyped names and land on lower-risk, more defensive, higher-quality plays. International diversification might also lead to better bargains for investors. The MSCI World ex-USA index of Developed Market stocks currently trades at a CAPE ratio of just over 20x—only modestly above its 20-year historical average level.
Disclosure: This material is for informational purposes only and should not be considered personalized investment advice. It does not consider the specific investment objectives, tax and financial condition or needs of any specific person and therefore, the strategies and investment ideas may not be suitable for all individuals. An investor should consult with their financial professional before making any investment decisions. The opinions contained herein are subject to change without notice. Indices cannot be invested in directly and are unmanaged. Past performance is not indicative of future results.
You are now leaving Rayliant.com
The following link may contain information concerning investments, products or other information.
PROCEED