“It’s tempting to draw sweeping conclusions from the first few months of data,
but history and economics both call for patience. Tariffs have a way of creeping into the
numbers with a lag, and we haven’t seen policy like this in almost 100 years.”
— Ernie Tedeschi, Director of Economics at Yale Budget Lab, writing for Bloomberg Opinion
For investors taking a behavioral perspective, the ebb and flow of stock prices reflects the day-to-day interaction of sentiment and fundamentals. It’s hard to deny that there have been big changes in sentiment in recent months. The S&P 500 slid by over 17% in the wake of trade turmoil from mid-February to early-April, then climbed back to near-record highs as tariff fears attenuated and the so-called “TACO” trade (“Trump Always Chickens Out”) took over. What’s been harder to pin down is how fundamentals are changing.
While we don’t doubt the moderation in Washington’s tariff tone is a net positive for stocks, even in the relatively optimistic scenarios for how trade policy plays out, levies come in higher than they’ve been since the late 1930s. Surely there’s going to be some fundamental impact! When it comes to measuring that impact, however, investors sifting through a stream of macro data for clues on the magnitude and timing of real economic effects from trade shocks have found those inferences to be, unfortunately, especially elusive.
Part of the issue is the obvious lag, as newly announced policies take some time to go into effect, then more time still for post-implementation activity to be surveyed and reported. In the case of data that might show an inflationary effect from tariffs—monthly released indicators like the usual CPI gauge, or the Fed’s preferred PCE Index—that means we’re looking at a lag of roughly 30 days from the time a policy officially kicks in. It’s the reason neither CPI nor PCE inflation showed a spike in April reports, in line with forecasts. In fact, most economists expect any surge in prices to build throughout the second half, as previously paused or deferred tariffs gradually reach full effect.
While these so-far muted inflation prints might be read by investors as good news for the economy and markets, other data points suggest a less rosy outlook. Survey data, in particular—which, importantly, can embed forward-looking expectations—have painted a gloomier picture, with confidence on the part of consumers tracked by the University of Michigan’s monthly poll down sharply in 2025. Similarly, American businesses surveyed in May by the Institute for Supply Management citing frustration forecasting and making decisions amidst tariff uncertainty.
Concern that businesses will respond to such risk by scaling back puts even more focus on data from the US labor market, but indications here have also muddied the waters. While a May report on private payrolls from ADP showed more loosening than expected, the official Bureau of Labor Statistics (BLS) May jobs data featured surprisingly strong job and wage growth.
Setting aside the fact that evidence on tariff effects so far has been a fairly mixed bag, another problem for data-oriented investors is that the observations streaming in for any given statistic reflect not only the direct impact of tariffs, but also the indirect effects of changes in trade policy on the behavior of consumers and businesses, which in turn flow through to the data. This shows up in registers of import/export activity—one of the first places changes in trade policy might be expected to show up—which is plotted below for a period spanning the last three-and-a-half decades.
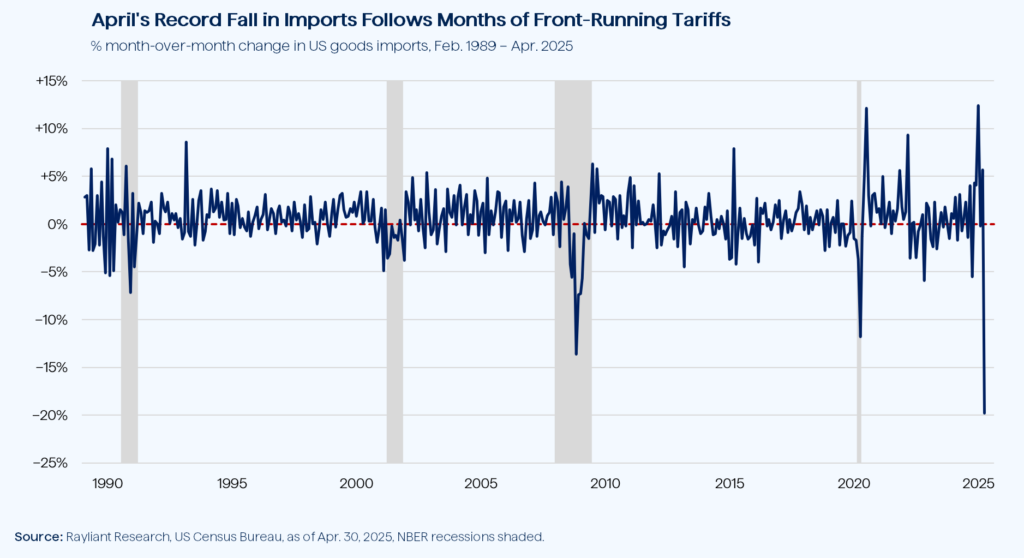
At the far right of the graph, we observe a record 20% decline in US goods imports from March to April 2025: the kind of drop we might not expect to see outside a recession. On the face of it, that seems like very bad news. Taking into account prior few data points, on the other hand, it seems pretty obvious that April’s pullback in trade is mostly a result of importers—who had been front-running Trump’s “Liberation Day” announcement for months with above-average orders—finally taking a breather. All of this complexity in the way government policy, along with the behavior of companies and consumers, jointly creates the data makes it that much harder to extrapolate trends from a few initial readings of typically low-frequency monthly or quarterly indicators.
All of this suggests to us that investors will do well to show patience as they try to make sense of tariff effects through the lens of incoming macro data. That’s certainly been the Fed’s approach—perhaps unsurprising given their admittedly “data-driven” orientation in setting policy. Indeed, minutes from May’s FOMC showed a central bank determined to proceed with caution in the absence of much clearer evidence as to how high prices might climb and how much trade chaos will drag on growth. Given how challenging such measurements have proven to be, traders pricing in two rate cuts for 2025 may also need to have some patience.
Disclosure: This material is for informational purposes only and should not be considered investment advice. The opinions contained herein are subject to change without notice. Indices cannot be invested in directly and are unmanaged.
You are now leaving Rayliant.com
The following link may contain information concerning investments, products or other information.
PROCEED